
The 499 error code, "client closed request", is the status nginx logs when the client side closes the connection before nginx sends the response headers. nginx writes this non-standard code only to its log, never to the client.
A 499 looks like the client's fault, even when a timeout in your own stack caused it. In our test behind Cloudflare, the visitor got a timeout page, nginx logged 499, and the app kept building a response nobody received.
This guide shows how to read the log line, find which timeout expired, and fix it, including in scrapers on residential proxies.
TL;DR
- Group your 499s by request time first. A cluster shows which timeout expired, while scattered request times are normal.
- The first timeout to expire decides the status code. If the client, CDN, or load balancer disconnects first, nginx logs 499. If nginx times out first, the client gets a 504.
- The backend keeps working unless it checks for the client disconnect. Flask, FastAPI, Node, and Go handlers without that check finished every abandoned request.
- When scraping through a proxy, set its idle timeout above your slowest page's time to first byte. On Evomi Core Residential,
_maxtimeout-sets it per request.
How to Read a 499 in the nginx Access Log
When the client closes the connection, nginx also closes its connection to the upstream, your app server, by default (proxy_ignore_client_abort off). Add timing variables to log_format in the http block:
log_format timing '$remote_addr xff=$http_x_forwarded_for "$request" '
                  '$status $body_bytes_sent rt=$request_time '
                  'urt=$upstream_response_time us=$upstream_status '
                  'done=$request_completion';
access_log /var/log/nginx/access.log timing;
If you change the format only once, also add rid=$request_id and realip=$realip_remote_addr now, because later sections use them. With the format above, an abandoned request looks like this:
192.168.155.1 xff=- "GET /sleep?s=5 HTTP/1.1" 499 0 rt=2.010 urt=2.010 us=- done=Each label in this line stands for an nginx variable:
$request_time(rt=) is how long the client waited before it closed the connection.$upstream_response_time(urt=) is how long nginx waited for the upstream.$upstream_status(us=) is-, because the upstream had not responded when the client closed the connection.$request_completion(done=) is empty, because nginx sets it toOKonly for completed requests.$http_x_forwarded_for(xff=) holds the original client IP when a CDN or load balancer in front of nginx addsX-Forwarded-For. The variable shows-when nothing adds the header.
Read together, this line says the client closed the connection after about 2 seconds, while the upstream was still working. Many lines with the same value point to a 2-second client timeout.
nginx also logs the reason, "client prematurely closed connection", but at the info level, which the default error log level leaves out. To see it while you investigate, set error_log /var/log/nginx/error.log info;.
Why You See 499 in Your Logs
Every 499 means the client side closed the connection before nginx responded. The client side is the client itself, or a hop in front of nginx, such as a CDN or load balancer.
Cause | Who controls it | How to tell from the log |
|---|---|---|
Client timeout shorter than your response time | The client developer | 499s from clients that connect directly cluster at one |
A user closes the tab or the app aborts the request | The user or the front end |
|
A load balancer, CDN, or reverse proxy in front of you times out | Whoever runs that hop | 499s cluster at the hop's timeout value, across all user agents |
A slow upstream | You | Your p99 |
A client half-closes its socket ( | The client developer |
|
An HTTP/2 client cancels one stream (one request on a shared connection) with | The client or browser | 499 on that request, while the connection stays open |
Behind a CDN or load balancer, two kinds of timeout produce a cluster, because the hop adds little latency:
- The hop's own timeout clusters at the hop's documented value, across all user agents.
- A client's timeout clusters just below the client's value, with that client's user agent. This needs a hop that closes its connection to nginx as soon as the client leaves, as Cloudflare did in our test.
Behind a hop whose latency varies per request, a client's timeout produces no cluster. Its 499s spread below the client's timeout.
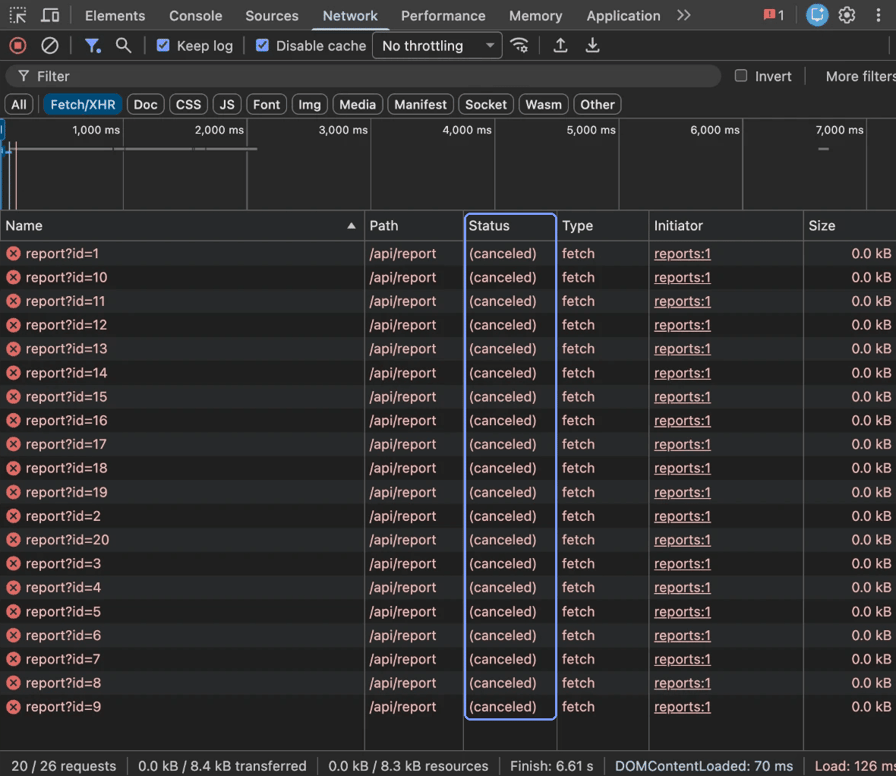
A 499 with a $request_time near 0 shows a request canceled before the app received it. On the client side, a canceled fetch() has no status code. It rejects with an AbortError, or with a TimeoutError if AbortSignal.timeout() canceled it. Chrome's Network panel shows it as (canceled):
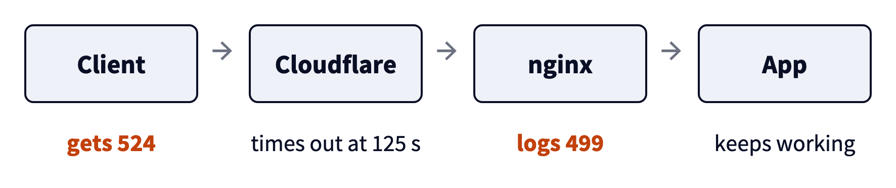
In production, check a cluster against platform defaults first. Cloudflare's 524 documentation lists 125 seconds for its proxy read timeout. Older guides say 100 seconds, so trust the current documentation. Behind Cloudflare, if your app sends nothing for that long and nginx's proxy_read_timeout is longer, the visitor gets Cloudflare's 524 error page. At the same moment, nginx logs 499 for that request, with a $request_time of about 125 seconds. So one request ends with two status codes, one at each end:
Each documented default timeout below produces a 499 cluster at its value:
| Likely timeout | What the client got | What to change |
|---|---|---|---|
300 s | Node's built-in | A client-side timeout ( |
|
300 s | The default total timeout of aiohttp, common in async Python scrapers | A client-side timeout |
|
180 s | Scrapy's DOWNLOAD_TIMEOUT default | A client-side timeout |
|
125 s | Cloudflare proxy read timeout | 524 | Run long work as a background job, or increase Proxy Read Timeout on an Enterprise plan |
60 s | AWS Application Load Balancer (ALB) idle timeout | 504 from the load balancer | The ALB's |
60 s | An iOS app on the | A client-side timeout ( |
|
60 s | An AI agent on the Model Context Protocol (MCP) TypeScript SDK's default request timeout | A client-side timeout | The MCP request |
30 s | Amazon CloudFront origin response timeout. For GET and HEAD requests, it makes up to 3 attempts by default, so one request can log three 499s | 504 | The origin's Response timeout, or run long work as a background job |
30 s | Google Cloud Application Load Balancer backend timeout | 502 | The backend service's |
30 s | Heroku's router | 503 (error H12) | Run long work as a background job |
29 to 30 s | Amazon API Gateway (29 s for REST APIs, 30 s for HTTP APIs) | 504 | Run long work as a background job, or request a higher integration timeout quota for a Regional or private REST API |
20 s | Azure Application Gateway request timeout | 504 (502 on the v1 SKU) | The request time-out in the backend settings |
15 s | Envoy's default route timeout, such as in Envoy Gateway when the HTTPRoute rule sets no timeout | 504 with |
|
10 s | OkHttp's read timeout in an Android app | A client-side timeout ( |
|
5 s | The default timeout of httpx, a common Python client | A client-side timeout ( |
|
5 s, on the health-check path | AWS Application Load Balancer health check timeout for instance and IP targets | A failed health check. After repeated failures, the load balancer marks the target unhealthy | Keep the health endpoint fast, or increase |
1 s, on the health-check path | Kubernetes liveness or readiness probe timeout, when nginx runs in the pod | A failed probe. Failed liveness probes restart the container, and failed readiness probes remove the pod from Service endpoints | Keep the health endpoint fast, or increase the probe's |
Python Requests and Go's http.Client have no default timeout, so a cluster from either one comes from a timeout that someone configured. Several timeouts share one value, so check the user agent to see which client it is before you change a platform setting.
With several hops in front of nginx, the shortest timeout usually expires first. Behind Cloudflare and a default AWS ALB, the ALB's 60-second timeout expires before Cloudflare's 125 seconds, so the client gets a 504, not a 524.
nginx's own proxy_read_timeout also defaults to 60 seconds, so in that setup either the ALB or nginx can send the 504. nginx logs 499 only when the ALB times out first. When you increase an outer timeout, increase proxy_read_timeout above your slowest response too.
How to Find the Timeout That Causes a 499 Spike
To triage a sudden 499 spike, work in this order:
- Group the 499s on the affected routes by
$request_time, with the script below. - Match each cluster to the defaults table, and check its client IPs and user agents. A user agent can show the SDK and its version.
- Compare the route's p99
$upstream_response_timebefore and after the spike. - Check for a deployment, a client release, or a changed timeout at the start of the spike.
- Compare the rate of scattered 499s with that route's baseline rate, not with a fixed threshold.
If you send your logs to a log management platform, run step 1 there as a histogram of request_time for 499s on one route.
If your log uses nginx's default combined format, it has no $request_time field. You can still start with the 499 count per route and per user agent:
awk '$9 == 499 {split($7, p, "?"); print p[1]}' access.log | sort | uniq -c | sort -rn | head
awk -F'"' '$3 ~ /^ 499 / {print $6}' access.log | sort | uniq -c | sort -rn | head
To find the timeout itself, log $request_time with the log_format from the first section. Then count 499s per second of $request_time, rounded:
awk '/" 499 / && match($0, /rt=[0-9.]+/) {printf "%.0f\n", substr($0, RSTART+3, RLENGTH-3)}' access.log | sort -n | uniq -cA tall count at one value is a cluster. The script below finds clusters for you and adds the top paths and clients.
Behind a CDN or load balancer, $remote_addr holds the hop's address, not the client's. To log the real client IP, set real_ip_header to X-Forwarded-For or CF-Connecting-IP, and list the hop's IP ranges as trusted with set_real_ip_from. The hop's address then moves to $realip_remote_addr, so log it too, to see which hop each request came through.
The script below, fingerprint_499.py, groups 499s by $request_time and lists the top paths and clients for each timeout. On a log that mixes client timeouts, a hop with a 3-second timeout, and user cancellations, the output looks like this:
311 lines with status 499
    175  request_time 1.871 to 2.021 s  a timeout near 2.0 s
       top paths: /sleep (95), /fastapi/sleep (20) | top clients: 192.168.148.1 (175)
     36  request_time 2.936 to 3.008 s  a timeout near 3.0 s
       top paths: /sleep (36) | top clients: 192.168.148.11 (36)
     34  request_time below 0.010 s  canceled before the app received it (queued or half-closed)
       top paths: /sleep (34) | top clients: 192.168.148.1 (34)
     66  spread: users, app code, or clients behind a proxy hop
The 3-second line is that hop's timeout, because all its requests come from the hop's address, 192.168.148.11. The 2-second line is a client timeout from the lab's direct clients, which share the Docker gateway address 192.168.148.1. In production, the client address alone does not separate a hop timeout from a client timeout. Match the value to the defaults table, and check user agents.
Run the script on one route's lines at a time, because many user cancellations on a busy route can hide a small cluster. Pass - to read from stdin, for rotated or Kubernetes logs:
grep '/api/search' access.log | python3 fingerprint_499.py -
gzip -dc access.log.*.gz | python3 fingerprint_499.py -
kubectl logs -n ingress-nginx -l app.kubernetes.io/component=controller --since=24h --tail=-1 | python3 fingerprint_499.py -
The script reads JSON logs, the ingress-nginx default format, and any format that logs $request_time as rt=. Save it as fingerprint_499.py:
# fingerprint_499.py
"""Find the timeouts that cause the 499s in an nginx access log.

A timeout appears as a spike of 499s at one $request_time, in addition to a
spread of users and apps that cancel at any time. The script counts 499s per
time bin and reports the bins that are much larger than the bins around them.

Reads three formats: JSON lines with "status" and "request_time" keys, the
ingress-nginx default format, and any format that writes "status ... rt=".
Usage: python3 fingerprint_499.py access.log
   or: gzip -dc access.log.*.gz | python3 fingerprint_499.py -
Source: https://evomi.com/blog/http-499-status-code
"""
import json
import math
import re
import statistics
import sys
from collections import Counter, defaultdict

RT_FORMAT = re.compile(r'^(\S+) .*?"\S+ (\S+) [^"]*" (\d{3}) .*?\brt=([\d.]+)')
INGRESS = re.compile(r'^(\S+) .*?"\S+ (\S+) [^"]*" (\d{3}) \d+ "[^"]*" "[^"]*" \d+ ([\d.]+) \[')

def parse(line):
    """Return (client, path, status, request_time) or None."""
    if line.startswith("{"):
        d = json.loads(line)
        path = d.get("request_uri") or d.get("uri") or "-"
        return d.get("remote_addr", "-"), path, str(d.get("status")), float(d["request_time"])
    m = RT_FORMAT.search(line) or INGRESS.search(line)
    return (m[1], m[2], m[3], float(m[4])) if m else None

def bin_of(rt):
    # 50 ms bins up to 2.5 s, then bins that grow by 2% each, so the jitter of one timeout fits in a few bins
    if rt < 2.5:
        return int(rt / 0.05)
    return 50 + int(math.log(rt / 2.5) / math.log(1.02))

if len(sys.argv) != 2:
    sys.exit("usage: python3 fingerprint_499.py access.log (or - to read standard input)")

rows = []
source = sys.stdin if sys.argv[1] == "-" else open(sys.argv[1], errors="replace")
for line in source:
    try:
        row = parse(line.strip())
    except (ValueError, KeyError):
        continue
    if row and row[2] == "499":
        rows.append(row)
if not rows:
    sys.exit("no 499 lines with a request time found")

instant = [r for r in rows if r[3] < 0.01]
bins = defaultdict(list)
for r in rows:
    if r[3] >= 0.01:
        bins[bin_of(r[3])].append(r)
keys = sorted(bins)

# A bin is a candidate when it holds at least 2 x (the median of the 10 bins around it + 1)
def background(k):
    return statistics.median(len(bins.get(n, [])) for n in range(k - 5, k + 6) if n != k)

candidates = [k for k in keys if len(bins[k]) >= 2 * (background(k) + 1)]

# Candidates up to 2 bins apart form one group. A group is a timeout only when its
# count is well above the random variation of the bins around it, not just above zero.
groups, current = [], []
for k in candidates:
    if current and k - current[-1] > 2:
        groups.append(current)
        current = []
    current.append(k)
if current:
    groups.append(current)
timers = []
for g in groups:
    total = sum(len(bins[k]) for k in g)
    base = sum(background(k) for k in g)
    if total >= 5 and total >= base + 3 * math.sqrt(base + 1) + 2:
        timers.append(g)
in_timer = {k for t in timers for k in t}
spread = [r for k in keys if k not in in_timer for r in bins[k]]

def describe(group):
    paths = Counter(r[1].split("?")[0] for r in group).most_common(2)
    clients = Counter(r[0] for r in group).most_common(2)
    return ("       top paths: " + ", ".join(f"{p} ({n})" for p, n in paths)
            + " | top clients: " + ", ".join(f"{a} ({n})" for a, n in clients))

print(f"{len(rows)} lines with status 499")
for t in sorted(timers, key=lambda t: -sum(len(bins[k]) for k in t)):
    group = sorted((r for k in t for r in bins[k]), key=lambda r: r[3])
    mid = group[len(group) // 2][3]
    print(f"{len(group):7}  request_time {group[0][3]:.3f} to {group[-1][3]:.3f} s  a timeout near {mid:.1f} s")
    print(describe(group))
if instant:
    print(f"{len(instant):7}  request_time below 0.010 s  canceled before the app received it (queued or half-closed)")
    print(describe(instant))
if spread:
    print(f"{len(spread):7}  spread: users, app code, or clients behind a proxy hop")
What Happens to the Request After a 499
The results below come from nginx 1.31.8 in front of a Flask app on gunicorn. The upstream needs 5 seconds, or 6 seconds for the streaming response. Each row sent 20 requests, and every request in a row ended the same way:
Setup | Client got | nginx logged | Backend finished |
|---|---|---|---|
Client timeout 2 s | Client-side timeout | 499, | 20 of 20 |
| A 504 response | 504, | 20 of 20 |
| Client-side timeout | 200, | 20 of 20 |
Streaming response, client timeout 2 s | 200 and 2 chunks, then a client-side timeout | 200, | 0 of 20 |
To run the four tests in this table yourself, use the setup in the section Reproduce 499 and 504 With nginx and a Slow Upstream.
With default settings, the first timeout to expire decides the status code. If the client's timeout expires first, the client gets no status code. nginx then logs 499, unless it has already sent the response headers. If nginx's proxy_read_timeout expires first, the client gets a 504 it can handle.
The status code does not show abandonment on streaming responses. nginx can log 499 only before it sends the response headers. When a user closes a chat tab halfway through a streamed LLM response, nginx therefore logs 200. On streaming routes, count requests with an empty $request_completion to measure the abandonment rate.
The backend finishes work that nobody will receive, unless its handler checks for the client disconnect. Flask, FastAPI on uvicorn, a plain Node http server, and a Go handler that ignored the request context all finished every request after its 499. A Go handler that checked r.Context().Done() stopped, and so did the streaming handler when its next write failed.
Under load, abandoned work exhausts the worker pool that new requests need. The test used 4 Flask workers, a 1.5-second endpoint, and 8 retrying clients, and measured goodput, the successful responses clients received. With a 10-second client timeout, goodput was about 160 a minute, the maximum for 4 workers. With a 2-second timeout, goodput fell to 4 a minute, because requests waited in the queue for more than 2 seconds. Almost every attempt ended as 499, and the workers kept serving abandoned requests for about 37 seconds after the clients had stopped.
How to Fix HTTP 499 on the Server
Match what the log shows to the fix:
What the log shows | Fix |
|---|---|
A low rate of scattered | Usually nothing. Users close tabs, and front ends abort requests |
499s at a | Usually nothing, because the app never received the request. A client that half-closes its socket needs a fix |
A cluster at a platform default | Increase that timeout and |
A cluster below your p99 latency | A faster upstream (an index, a cache, or pagination), or run long work as a background job |
Three 499s per call from clients that use the OpenAI or Anthropic SDK | Stream LLM responses |
Workers still busy after the clients disconnected | Propagate the cancellation to your handler, or reject requests that waited too long |
Autocomplete fields and single-page apps cancel earlier requests by design, so expect some 499s on those endpoints.
Many error-rate dashboards and service-level objectives (SLOs) count only 5xx responses, so they can miss a slow endpoint that users abandon. Count 499s whose $request_time is above your latency SLO as errors, and do not count the scattered ones.
Measure the wasted work before you change timeouts. nginx cannot show whether the backend finished an abandoned request, because it stops timing the upstream when it closes that connection. Add proxy_set_header X-Request-ID $request_id; to the location block and rid=$request_id to log_format, and have the app log done and that ID when it finishes. $request_id is unique per request, so you can then join the two logs:
grep '" 499 ' access.log | grep -o 'rid=[0-9a-f]*' | cut -d= -f2 | sort -u > abandoned.txt
grep -o 'done [0-9a-f]\{32\}' app.log | cut -d' ' -f2 | sort -u > finished.txt
echo "$(comm -12 abandoned.txt finished.txt | wc -l | tr -d ' ') of $(wc -l < abandoned.txt | tr -d ' ') abandoned requests still finished"
For a log with a mix of 499 causes, the commands print:
186 of 240 abandoned requests still finishedEach finished request is wasted work. The app never received the others, or they reached a handler that checked for the client disconnect. A 499 near 0 seconds costs the backend little or nothing.
Make inner timeouts shorter than outer ones. The hop nearest your app should time out first, and the client last. From shortest to longest, the order is the application deadline, proxy_read_timeout, the load balancer timeout, and the client timeout. Set even the shortest one above the endpoint's p99 latency.
The innermost hop then returns a status code, such as nginx's 504. The caller can report that status, or retry an idempotent request, one that is safe to repeat. For clients that allow 30 seconds, this location block returns a 504 before the client times out:
location /api/reports/ {
    proxy_connect_timeout 5s;
    proxy_read_timeout    25s;   # expires before the client's 30 s timeout
    proxy_pass http://app:8000;
}
With Gateway API, set timeouts.request on the HTTPRoute rule, because without it, the controller's default applies, such as 15 seconds on Envoy Gateway. On ingress-nginx, use the nginx.ingress.kubernetes.io/proxy-read-timeout annotation, in seconds. That annotation defaults to 60 seconds, so routes that worked on ingress-nginx can start returning 504s at 15 seconds after a move to Envoy Gateway.
proxy_read_timeout measures the time between two successive reads, not the whole response. An upstream that sends a byte every few seconds never makes it expire.
Include the application server in this timeout order. gunicorn kills a sync worker that spends more than 30 seconds on one request by default (--timeout), and nginx then returns 502. If the upstream block lists several servers, nginx also retries a timed-out request on the next server by default (proxy_next_upstream). nginx does not retry non-idempotent requests such as POST this way, but a slow GET can run twice.
Run long work as a background job. If a report, an export, or an LLM call takes longer than clients wait, accept the job and return 202 Accepted with a status URL. The client then polls, and no connection stays open for the slow part.
Stream LLM responses. The OpenAI and Anthropic Python SDKs retry twice on a timeout by default, even for a POST. With a 3-second client timeout against a 10-second endpoint, each call produced three 499 lines, and the backend finished all three. In the tested versions, openai 3.42.0 and anthropic 2.3.0, both SDKs sent their retry number in the X-Stainless-Retry-Count header. Log $http_x_stainless_retry_count to distinguish retries from new requests.
Clients of an OpenAI-compatible API expect the response in the same request, not a 202 Accepted status URL, so stream the response. Each streamed chunk resets the client's read timeout, and a streaming handler stops when its next write to a closed connection fails.
Propagate the cancellation to your handler. nginx closes the upstream connection on a 499, but a handler stops only if it checks for the client disconnect. The Go handler that stopped after the client disconnected used this pattern:
select {
case <-time.After(work):  // simulates the real work
    fmt.Fprintln(w, "done")
case <-r.Context().Done(): // nginx closed the upstream connection
    return                 // stop and skip the side effects
}
Starlette and FastAPI offer await request.is_disconnected(). Django 5.0 and later raises asyncio.CancelledError in async views under ASGI.
In Node 26.1 and later, pass req.signal to fetch() and database calls. Behind nginx, the signal aborts the slow call as soon as the client disconnects. On earlier versions, listen for the response close event and abort downstream calls yourself.
The database needs the same signal, because PostgreSQL keeps running a query after the HTTP client disconnects. In Go, pass the request context into the query with QueryContext, so the pgx driver can cancel it. As a safety limit, set statement_timeout, which is disabled by default.
Reject requests that waited too long (load shedding). A synchronous Python app on WSGI, such as Flask or sync Django under gunicorn, cannot detect a client disconnect while the handler runs. Under overload, many requests are already abandoned when a handler starts, because their queue time has exceeded the client's timeout. Have nginx add an X-Request-Start header with the time it forwarded each request, in milliseconds:
# http context: $msec without the dot, in milliseconds
map $msec $msec_ms {
    "~^(?<s>\d+)\.(?<ms>\d+)$" "$s$ms";
}

# in the location that proxies to the app
proxy_set_header X-Request-Start $msec_ms;
Then, in the app, reject each request that can no longer finish within its client's timeout:
import time
from flask import request

CLIENT_TIMEOUT = 2.0  # the shortest timeout your clients use, in seconds
NORMAL_TIME = 1.5  # how long the endpoint normally takes, in seconds
MAX_QUEUE = CLIENT_TIMEOUT - NORMAL_TIME

@app.before_request
def shed_late_requests():
    start = request.headers.get("X-Request-Start", "")  # milliseconds, set by nginx
    if start.isdigit() and time.time() - int(start) / 1000 > MAX_QUEUE:
        return "queued too long\n", 503, {"Retry-After": "1"}
In the same 4-worker overload test, load shedding increased goodput for the same 2-second clients from 4 to about 160 successful responses a minute. The result matches clients with a 10-second timeout, and no abandoned work ran after the clients stopped.
A CLIENT_TIMEOUT below the timeout your clients use rejects requests they would have waited for, so jobs fail that would have succeeded. The check also needs synchronized clocks on nginx and the app, which NTP usually keeps within a few milliseconds. For Django, django-request-queue-timeout does the same and reads this X-Request-Start header in milliseconds.
Use proxy_ignore_client_abort only where work must finish. The directive makes nginx log abandoned requests with the upstream's status, such as 200, instead of 499. The directive also keeps the upstream connection open, so even a handler that checks for the client disconnect still finishes. Enable it only in the location blocks where a half-finished operation costs more than the wasted work.
How to Fix HTTP 499 on the Client
Set the read timeout from the endpoint's measured p99 latency plus a safety margin, not from a library default. Separate connect and read timeouts so a slow connection and a slow response raise different errors.
Treat a timeout as an unknown outcome, because the server may still finish the request. An automatic retry of a POST can therefore create a duplicate order. Retry only idempotent requests, with exponential backoff and jitter. Limit retries with a retry budget, which caps retries at a percentage of all requests, so a slow server does not cause a retry storm.
For a POST, send an idempotency key if the API supports one, so the server can deduplicate the request and return the original response. For code examples, retrying failed Python requests with backoff and retry logic for failed Axios requests show exponential backoff for Python and Node clients.
What Other Reverse Proxies Log Instead of 499
Reverse proxies and load balancers log a client disconnect with different status codes, which matters if you're migrating from ingress-nginx. Kubernetes retired ingress-nginx in March 2026 and recommends Gateway API. NGINX Gateway Fabric runs nginx and still logs 499, but many Gateway API implementations run on Envoy, which logs a different code.
Rows marked Tested used the same 2-second client-side timeout:
Reverse proxy or load balancer | Logged on client disconnect | Source |
|---|---|---|
nginx 1.31.8 | 499 | Tested |
Traefik 3.7.17 | 499 | Tested |
Caddy 2.11.7 | 499 (status 0 before v2.11.5) | Tested |
HAProxy 3.4.7 | 400 with termination state | Tested |
Envoy 1.36.13 | 0 with response flag | Tested |
AWS Application Load Balancer | 460 | |
Google Cloud Application Load Balancer | 0 with | |
Azure Application Gateway v2 | 499 | |
Cloudflare | 499 in logs and analytics, even after the response has started |
After a migration, an alert on 499 can stop firing. HAProxy logs client aborts as 400, which can fire an alert on 400 Bad Request. Envoy and Google Cloud log them as status 0, which a 4xx alert does not detect. Alert on what your load balancer or reverse proxy actually logs for a disconnect, including any termination state, response flag, or status detail.
How to Prevent 499s When Scraping Through a Proxy
On a slow page, your scraper gets a ReadTimeout, so you lose the page, and a site on nginx or Cloudflare logs a 499. First check your client's own timeout. httpx stops at 5 seconds by default, Scrapy at 180, and aiohttp at 300, while Requests has no default. A page with a long time to first byte needs a tunnel that stays open until the first byte arrives. Evomi Core Residential proxies let you set how long a tunnel to the origin may stay idle, with no data in either direction, per request. Add the _maxtimeout- parameter with the idle time in seconds to your proxy password, such as _maxtimeout-120. A scraper can then give slow sites a longer idle timeout than fast ones.
HTTPS goes through a CONNECT tunnel, so after the tunnel opens, the status codes you see come from the origin itself. A slow page therefore appears in your client as a timeout. Keep your read timeout slightly under the idle timeout, so your own client times out first and raises a clear ReadTimeout.
Find your credentials in the Proxy Generator in your Evomi dashboard:
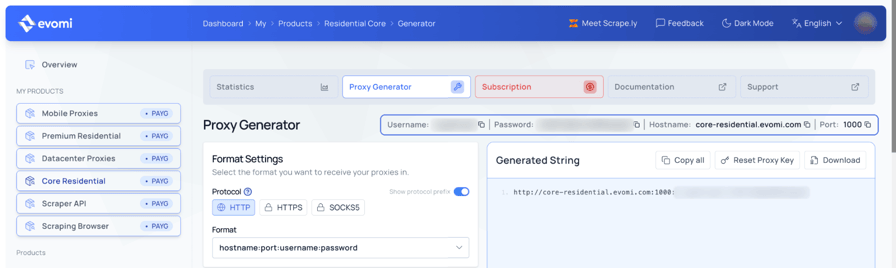
Replace USERNAME and PASSWORD in this snippet with your credentials, and keep the _maxtimeout-120 suffix:
import requests

USERNAME = "USERNAME"
PASSWORD = "PASSWORD_maxtimeout-120"  # the idle timeout you choose: 120 s
proxy = f"http://{USERNAME}:{PASSWORD}@core-residential.evomi.com:1000"

response = requests.get(
    "https://ip.evomi.com/s",
    proxies={"http": proxy, "https": proxy},
    timeout=(10, 110),  # connect, read: read stays under the idle timeout
)
print(response.status_code, response.text)
The ip.evomi.com/s endpoint returns your exit IP:
200 203.0.113.xTo check one slow URL from the shell, use the same settings with curl. The timings show where the wait happens:
curl -s -o /dev/null --max-time 110 \
  -x "http://USERNAME:PASSWORD_maxtimeout-120@core-residential.evomi.com:1000" \
  -w 'connect %{time_connect}  tls %{time_appconnect}  first byte %{time_starttransfer}\n' \
  https://example.com/slow-page
If first byte comes long after tls, the site itself is slow to respond, so give that site a longer _maxtimeout-.
At scale, track response time per target domain and set each domain's read timeout and _maxtimeout- from its own p99 latency. A single global value set for typical sites is too short for slow sites, where it causes 499s at the origin. The same value is too long for fast sites, where hung requests wait longer than needed.
When many requests to one site time out, reduce your concurrency, because more concurrent requests can make a slow origin slower. Some sites also delay responses to clients they rate-limit, and a longer timeout does not fix that. Follow the site's robots.txt and terms of service as you adjust your crawl rate.
Evomi Scraper API can also fetch slow pages for you. With "async": true, a request returns 202 Accepted and a task URL, so no connection of yours stays open while the page loads. You poll that URL for the full page.
The API retries transient errors on its side, so your own code needs few retries.
Reproduce 499 and 504 With nginx and a Slow Upstream
This setup runs nginx 1.31.8 in front of a Flask app on gunicorn. Its /sleep endpoint takes as many seconds as the s query parameter. Save the three files in one empty directory, and run the stack only on your own machine.
The app prints a line for each request it finishes, so you can see whether abandoned work completes:
# app.py
import time
from flask import Flask, Response, request

app = Flask(__name__)

@app.get("/sleep")
def sleep():
    seconds = float(request.args.get("s", 5))
    time.sleep(seconds)  # simulates a slow query or an LLM call
    print(f"finished {request.full_path}", flush=True)
    return f"slept {seconds}\n"

@app.get("/stream")
def stream():
    def chunks():
        for i in range(6):
            yield f"chunk {i}\n"
            time.sleep(1)
        print("stream finished", flush=True)
    return Response(chunks(), mimetype="text/plain")
The nginx config gives each timeout scenario its own location block and logs the timing variables:
# nginx.conf
log_format timing '$remote_addr xff=$http_x_forwarded_for "$request" '
                  '$status $body_bytes_sent rt=$request_time '
                  'urt=$upstream_response_time us=$upstream_status '
                  'done=$request_completion';

server {
    listen 8080;
    access_log /dev/stdout timing;

    location /        { proxy_pass http://app:8000; }
    location /short/  { proxy_read_timeout 3s; proxy_pass http://app:8000/; }
    location /ignore/ { proxy_ignore_client_abort on; proxy_pass http://app:8000/; }
    location /stream  { proxy_buffering off; proxy_pass http://app:8000; }
}
The Compose file starts both containers and publishes nginx on port 8080:
# compose.yaml
services:
  app:
    image: python:3.14-slim
    volumes: ["./app.py:/app/app.py:ro"]
    working_dir: /app
    command: >
      sh -c "pip install -q flask==3.1.3 gunicorn==26.2.0 &&
             gunicorn -w 8 --timeout 120 -b 0.0.0.0:8000 app:app"
  nginx:
    image: nginx:1.31.8-alpine
    ports: ["${PORT:-8080}:8080"]
    volumes: ["./nginx.conf:/etc/nginx/conf.d/default.conf:ro"]
    depends_on: [app]
Start the stack with docker compose up -d. Wait until docker compose logs app shows gunicorn's Booting worker lines, which takes about 20 seconds. Then send 20 requests with a 2-second client timeout to an endpoint that needs 5 seconds:
for i in $(seq 20); do
  curl -s -o /dev/null --max-time 2 "localhost:8080/sleep?s=5"; echo "curl exit $?"
done | sort | uniq -c
Each client reaches its own timeout (curl exit code 28) and gets no status code:
20 curl exit 28docker compose logs nginx shows 20 lines with status 499, while docker compose logs app shows 20 finished lines. Python Requests and Node fetch behave the same way.
Run the same loop against localhost:8080/ignore/sleep?s=5 and localhost:8080/stream, and against localhost:8080/short/sleep?s=5 with --max-time 10. Each loop sends 20 requests and produces one row of the results table above.
How 499 Differs From 504, 502, and Other Codes
These related codes come from the same chain of client, proxy, CDN, and server as 499:
Code | Who sends it | What it means |
|---|---|---|
A forward proxy | The proxy needs valid credentials in the | |
408 Request Timeout | The server (nginx logs it but sends nothing) | The client sent its request too slowly, and |
499 Client Closed Request | No one. nginx only logs it | The client closed the connection before nginx sent the response headers |
502 Bad Gateway | A gateway or reverse proxy | The upstream refused or closed the connection, or sent an invalid response |
503 Service Unavailable | The server or a load balancer | The server cannot handle the request now, for example when it rejects requests that waited too long in the queue |
504 Gateway Timeout | A gateway or reverse proxy | The upstream did not respond within the gateway's timeout |
524 A Timeout Occurred | Cloudflare | The origin did not respond within Cloudflare's proxy read timeout. nginx logs 499 for the same request |
Wrapping Up
A 499 means the client stopped waiting, but your backend can keep working unless its handler checks for the client disconnect. Read $request_time before you change anything, because a cluster at one value shows which timeout expired, even after vendors change their defaults. Then order your timeouts so the innermost hop times out first and returns a status code.
When the work outlasts every client's timeout, move it to a background job instead of increasing timeouts again. For slow target sites, set _maxtimeout- per site on Evomi Core Residential, or fetch those pages with Evomi Scraper API and poll for the result.
FAQ
How to fix error 499?
Find which timeout expired. A cluster of 499s at one $request_time usually shows a client, CDN, or load balancer timeout. Then make the endpoint faster, run long work as a background job, or increase that timeout. Keep proxy_read_timeout above your p99 latency and below the client's timeout.
What is meant by 499?
Error 499 is the "client closed request" status that nginx logs but never sends. nginx logs it when the client closes the connection before nginx sends the response headers. Cloudflare, Traefik, Caddy 2.11.5 and later, and Azure Application Gateway v2 log the same code for a client disconnect.
What is the 499 service code?
As a service status code, 499 means "client closed request", so the caller disconnected before the service responded. nginx defined it, and ASP.NET Core and Azure App Service use it too. In a service dashboard, a 499 usually means a client timeout or a canceled call.
What does error 499 mean in an API?
In an API or SDK, a 499 usually means the request was canceled before a response arrived. Google APIs map the gRPC CANCELLED status to 499, so their SDKs can show it. Check your network connection, increase the client timeout for slow operations, and retry only idempotent requests, which are safe to repeat.
Is 499 a client or server problem?
A 499 can be either. The client closed the connection, but a cluster at one $request_time below your p99 latency means your slowest responses take longer than that client waits. Scattered $request_time values come from closed tabs or aborted requests, and a small rate usually needs no fix.