Setting Up Prometheus + Grafana to Monitor Your Scraping Fleet


The Scraper
Setup Guides
You added alerting. You check the logs. But you have no idea whether your scrapers are healthy until a downstream team files a ticket. By then, you've been serving stale data for six hours.
This guide builds a Prometheus + Grafana monitoring stack for a scraping fleet, one that catches soft blocks, data quality degradation, and proxy failures before they reach production.
Prerequisites
Docker and Docker Compose
Python scraper(s) exposing a metrics endpoint (or adaptable to do so)
30 minutes
Architecture
[Scraper Workers] → expose /metrics → [Prometheus] → [Grafana dashboards + alerts]
                                           ↑
                                    [Alertmanager]
                                           ↓
                                  [PagerDuty / Slack]
Prometheus scrapes your scraper workers' /metrics endpoints on a configurable interval. Grafana queries Prometheus for dashboards and alert evaluation.
Step 1: Instrument Your Scrapers
Add metrics to your scraper workers using the prometheus_client library:
# metrics.py
from prometheus_client import (
    Counter, Histogram, Gauge, Summary,
    start_http_server, REGISTRY
)

# Request metrics
requests_total = Counter(
    'scraper_requests_total',
    'Total HTTP requests made',
    ['target', 'status_code']
)

request_duration = Histogram(
    'scraper_request_duration_seconds',
    'HTTP request duration',
    ['target'],
    buckets=[0.1, 0.5, 1.0, 2.0, 5.0, 10.0, 30.0]
)

# Data quality metrics
records_extracted = Counter(
    'scraper_records_extracted_total',
    'Records successfully extracted',
    ['target']
)

schema_failures = Counter(
    'scraper_schema_failures_total',
    'Schema validation failures',
    ['target', 'field']
)

price_anomalies = Counter(
    'scraper_price_anomalies_total',
    'Price range guard violations',
    ['target', 'category']
)

null_field_rate = Gauge(
    'scraper_null_field_rate',
    'Proportion of records with null for a given field (soft block indicator)',
    ['target', 'field']
)

# Data freshness
change_rate = Gauge(
    'scraper_data_change_rate',
    'Proportion of records that changed vs. last run',
    ['target']
)

# Proxy metrics
proxy_success_rate = Gauge(
    'scraper_proxy_success_rate',
    'Success rate for current proxy pool',
    ['target', 'proxy_pool']
)

active_sessions = Gauge(
    'scraper_active_sessions',
    'Number of active browser/HTTP sessions',
    ['target']
)

# Job metrics
job_duration = Summary(
    'scraper_job_duration_seconds',
    'Total job duration',
    ['target', 'job_type']
)

last_successful_run = Gauge(
    'scraper_last_successful_run_timestamp',
    'Unix timestamp of last successful run',
    ['target']
)

def start_metrics_server(port: int = 8000):
    """Start Prometheus metrics HTTP server."""
    start_http_server(port)
    print(f"Metrics server started on :{port}/metrics")
Integrate into your scraper:
# In your scraper worker
from metrics import (
    requests_total, request_duration, records_extracted,
    schema_failures, null_field_rate, last_successful_run,
    start_metrics_server
)
import time

start_metrics_server(8000)

async def fetch_and_extract(url: str, target: str):
    start = time.time()
    try:
        html = await fetch_page(url)
        requests_total.labels(target=target, status_code='200').inc()
    except httpx.HTTPStatusError as e:
        requests_total.labels(target=target, status_code=str(e.response.status_code)).inc()
        raise
    finally:
        request_duration.labels(target=target).observe(time.time() - start)

    record = parse_product_page(url, html)
    if record:
        records_extracted.labels(target=target).inc()
    else:
        schema_failures.labels(target=target, field='parse_failure').inc()

    return record
Step 2: Docker Compose Setup
# docker-compose.yml
version: '3.8'

services:
  prometheus:
    image: prom/prometheus:v2.51.0
    ports:
      - "9090:9090"
    volumes:
      - ./prometheus.yml:/etc/prometheus/prometheus.yml
      - ./alerts.yml:/etc/prometheus/alerts.yml
      - prometheus_data:/prometheus
    command:
      - '--config.file=/etc/prometheus/prometheus.yml'
      - '--storage.tsdb.retention.time=30d'

  grafana:
    image: grafana/grafana:10.4.0
    ports:
      - "3000:3000"
    environment:
      - GF_SECURITY_ADMIN_PASSWORD=your_password
    volumes:
      - grafana_data:/var/lib/grafana
      - ./grafana/dashboards:/etc/grafana/provisioning/dashboards
      - ./grafana/datasources:/etc/grafana/provisioning/datasources
    depends_on:
      - prometheus

  alertmanager:
    image: prom/alertmanager:v0.27.0
    ports:
      - "9093:9093"
    volumes:
      - ./alertmanager.yml:/etc/alertmanager/alertmanager.yml

volumes:
  prometheus_data:
  grafana_data:
Step 3: Prometheus Configuration
# prometheus.yml
global:
  scrape_interval: 30s
  evaluation_interval: 30s

alerting:
  alertmanagers:
    - static_configs:
        - targets: ['alertmanager:9093']

rule_files:
  - 'alerts.yml'

scrape_configs:
  # Scraper worker metrics
  - job_name: 'scraper_workers'
    static_configs:
      - targets:
          - 'scraper-worker-1:8000'
          - 'scraper-worker-2:8000'
          - 'scraper-worker-3:8000'
    # Or use service discovery:
    # file_sd_configs:
    #   - files: ['scraper_targets.json']
Step 4: Alerting Rules
# alerts.yml
groups:
  - name: scraper_alerts
    rules:

      # Stale data: scraper hasn't completed a successful run in 2 hours
      - alert: ScraperStaleData
        expr: (time() - scraper_last_successful_run_timestamp) > 7200
        for: 5m
        labels:
          severity: warning
        annotations:
          summary: "Scraper {{ $labels.target }} hasn't run successfully in 2h"
          description: "Last successful run was {{ $value | humanizeDuration }} ago"

      # High null rate: likely soft block or schema change
      - alert: HighNullFieldRate
        expr: scraper_null_field_rate > 0.15
        for: 10m
        labels:
          severity: critical
        annotations:
          summary: "High null rate on {{ $labels.target }}.{{ $labels.field }}"
          description: "{{ $value | humanizePercentage }} of records have null {{ $labels.field }} — possible soft block"

      # Price anomaly spike
      - alert: PriceAnomalySpike
        expr: rate(scraper_price_anomalies_total[10m]) > 0.1
        for: 5m
        labels:
          severity: warning
        annotations:
          summary: "Price anomaly rate spike on {{ $labels.target }}"

      # Proxy success rate degradation
      - alert: ProxySuccessRateLow
        expr: scraper_proxy_success_rate < 0.7
        for: 5m
        labels:
          severity: critical
        annotations:
          summary: "Proxy pool success rate below 70% for {{ $labels.target }}"
          description: "Current rate: {{ $value | humanizePercentage }}"

      # Schema failures — sudden jump suggests layout change
      - alert: SchemaFailureSpike
        expr: rate(scraper_schema_failures_total[5m]) > 1
        for: 5m
        labels:
          severity: warning
        annotations:
          summary: "Schema failure rate elevated on {{ $labels.target }}"
Step 5: Alertmanager Configuration
# alertmanager.yml
global:
  slack_api_url: 'https://hooks.slack.com/services/YOUR/WEBHOOK/URL'

route:
  group_by: ['alertname', 'target']
  group_wait: 30s
  group_interval: 5m
  repeat_interval: 1h
  receiver: 'slack-scraper-alerts'

  routes:
    - match:
        severity: critical
      receiver: 'pagerduty-oncall'

receivers:
  - name: 'slack-scraper-alerts'
    slack_configs:
      - channel: '#scraper-alerts'
        title: 'Scraper Alert: {{ .GroupLabels.alertname }}'
        text: '{{ range .Alerts }}{{ .Annotations.description }}{{ end }}'

  - name: 'pagerduty-oncall'
    pagerduty_configs:
      - routing_key: 'YOUR_PAGERDUTY_KEY'
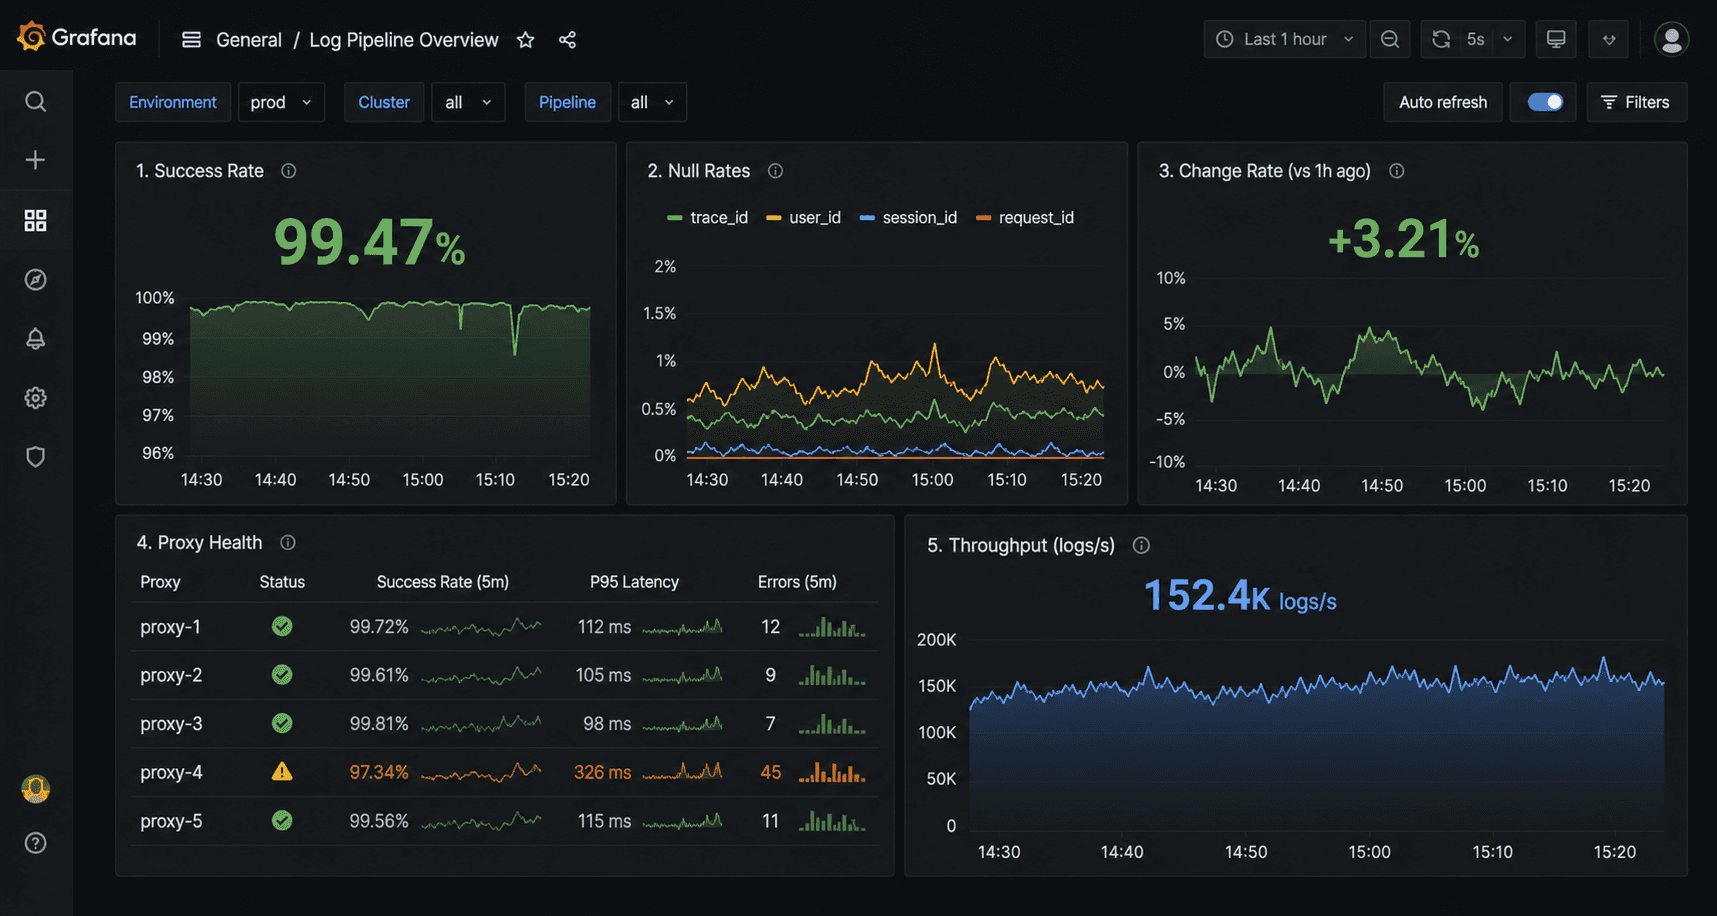
Step 6: Grafana Dashboard
Provision a dashboard automatically by adding a JSON file to ./grafana/dashboards/. Key panels to include:
Panel 1: Request Success Rate by Target
rate(scraper_requests_total{status_code="200"}[5m]) /
rate(scraper_requests_total[5m])
Panel 2: Null Field Rate Heatmap
scraper_null_field_ratePanel 3: Data Change Rate (Freshness)
scraper_data_change_ratePanel 4: Proxy Pool Success Rate
scraper_proxy_success_ratePanel 5: Records Extracted per Minute
rate(scraper_records_extracted_total[5m]) * 60
Common Pitfalls
Pitfall 1: Scraping Prometheus instead of pushing. For short-lived jobs (one-shot scripts, not long-running services), push metrics to a Pushgateway rather than expecting Prometheus to scrape a /metrics endpoint that may be gone before the next scrape interval.
Pitfall 2: High cardinality labels. Don't use URL as a label value, that creates one time series per unique URL, which can be millions. Keep label cardinality bounded: target, status_code, field, proxy_pool.
Pitfall 3: Alert fatigue. Start with only the critical alerts (stale data, high null rate). Add more only after the critical ones have proven useful. Too many alerts = ignored alerts.
Conclusion
A working Prometheus + Grafana stack for scraping takes a few hours to set up and prevents the class of failures where everything looks fine until it isn't. The null rate alert alone is worth the setup time, it's the metric that catches soft blocks before your downstream consumers do.
Pair this with clean proxy infrastructure from Evomi and you'll see the proxy success rate metrics staying consistently high, a baseline that makes the anomalies meaningful when they do appear. You can test Evomi's proxies with a completely free trial.
You added alerting. You check the logs. But you have no idea whether your scrapers are healthy until a downstream team files a ticket. By then, you've been serving stale data for six hours.
This guide builds a Prometheus + Grafana monitoring stack for a scraping fleet, one that catches soft blocks, data quality degradation, and proxy failures before they reach production.
Prerequisites
Docker and Docker Compose
Python scraper(s) exposing a metrics endpoint (or adaptable to do so)
30 minutes
Architecture
[Scraper Workers] → expose /metrics → [Prometheus] → [Grafana dashboards + alerts]
                                           ↑
                                    [Alertmanager]
                                           ↓
                                  [PagerDuty / Slack]
Prometheus scrapes your scraper workers' /metrics endpoints on a configurable interval. Grafana queries Prometheus for dashboards and alert evaluation.
Step 1: Instrument Your Scrapers
Add metrics to your scraper workers using the prometheus_client library:
# metrics.py
from prometheus_client import (
    Counter, Histogram, Gauge, Summary,
    start_http_server, REGISTRY
)

# Request metrics
requests_total = Counter(
    'scraper_requests_total',
    'Total HTTP requests made',
    ['target', 'status_code']
)

request_duration = Histogram(
    'scraper_request_duration_seconds',
    'HTTP request duration',
    ['target'],
    buckets=[0.1, 0.5, 1.0, 2.0, 5.0, 10.0, 30.0]
)

# Data quality metrics
records_extracted = Counter(
    'scraper_records_extracted_total',
    'Records successfully extracted',
    ['target']
)

schema_failures = Counter(
    'scraper_schema_failures_total',
    'Schema validation failures',
    ['target', 'field']
)

price_anomalies = Counter(
    'scraper_price_anomalies_total',
    'Price range guard violations',
    ['target', 'category']
)

null_field_rate = Gauge(
    'scraper_null_field_rate',
    'Proportion of records with null for a given field (soft block indicator)',
    ['target', 'field']
)

# Data freshness
change_rate = Gauge(
    'scraper_data_change_rate',
    'Proportion of records that changed vs. last run',
    ['target']
)

# Proxy metrics
proxy_success_rate = Gauge(
    'scraper_proxy_success_rate',
    'Success rate for current proxy pool',
    ['target', 'proxy_pool']
)

active_sessions = Gauge(
    'scraper_active_sessions',
    'Number of active browser/HTTP sessions',
    ['target']
)

# Job metrics
job_duration = Summary(
    'scraper_job_duration_seconds',
    'Total job duration',
    ['target', 'job_type']
)

last_successful_run = Gauge(
    'scraper_last_successful_run_timestamp',
    'Unix timestamp of last successful run',
    ['target']
)

def start_metrics_server(port: int = 8000):
    """Start Prometheus metrics HTTP server."""
    start_http_server(port)
    print(f"Metrics server started on :{port}/metrics")
Integrate into your scraper:
# In your scraper worker
from metrics import (
    requests_total, request_duration, records_extracted,
    schema_failures, null_field_rate, last_successful_run,
    start_metrics_server
)
import time

start_metrics_server(8000)

async def fetch_and_extract(url: str, target: str):
    start = time.time()
    try:
        html = await fetch_page(url)
        requests_total.labels(target=target, status_code='200').inc()
    except httpx.HTTPStatusError as e:
        requests_total.labels(target=target, status_code=str(e.response.status_code)).inc()
        raise
    finally:
        request_duration.labels(target=target).observe(time.time() - start)

    record = parse_product_page(url, html)
    if record:
        records_extracted.labels(target=target).inc()
    else:
        schema_failures.labels(target=target, field='parse_failure').inc()

    return record
Step 2: Docker Compose Setup
# docker-compose.yml
version: '3.8'

services:
  prometheus:
    image: prom/prometheus:v2.51.0
    ports:
      - "9090:9090"
    volumes:
      - ./prometheus.yml:/etc/prometheus/prometheus.yml
      - ./alerts.yml:/etc/prometheus/alerts.yml
      - prometheus_data:/prometheus
    command:
      - '--config.file=/etc/prometheus/prometheus.yml'
      - '--storage.tsdb.retention.time=30d'

  grafana:
    image: grafana/grafana:10.4.0
    ports:
      - "3000:3000"
    environment:
      - GF_SECURITY_ADMIN_PASSWORD=your_password
    volumes:
      - grafana_data:/var/lib/grafana
      - ./grafana/dashboards:/etc/grafana/provisioning/dashboards
      - ./grafana/datasources:/etc/grafana/provisioning/datasources
    depends_on:
      - prometheus

  alertmanager:
    image: prom/alertmanager:v0.27.0
    ports:
      - "9093:9093"
    volumes:
      - ./alertmanager.yml:/etc/alertmanager/alertmanager.yml

volumes:
  prometheus_data:
  grafana_data:
Step 3: Prometheus Configuration
# prometheus.yml
global:
  scrape_interval: 30s
  evaluation_interval: 30s

alerting:
  alertmanagers:
    - static_configs:
        - targets: ['alertmanager:9093']

rule_files:
  - 'alerts.yml'

scrape_configs:
  # Scraper worker metrics
  - job_name: 'scraper_workers'
    static_configs:
      - targets:
          - 'scraper-worker-1:8000'
          - 'scraper-worker-2:8000'
          - 'scraper-worker-3:8000'
    # Or use service discovery:
    # file_sd_configs:
    #   - files: ['scraper_targets.json']
Step 4: Alerting Rules
# alerts.yml
groups:
  - name: scraper_alerts
    rules:

      # Stale data: scraper hasn't completed a successful run in 2 hours
      - alert: ScraperStaleData
        expr: (time() - scraper_last_successful_run_timestamp) > 7200
        for: 5m
        labels:
          severity: warning
        annotations:
          summary: "Scraper {{ $labels.target }} hasn't run successfully in 2h"
          description: "Last successful run was {{ $value | humanizeDuration }} ago"

      # High null rate: likely soft block or schema change
      - alert: HighNullFieldRate
        expr: scraper_null_field_rate > 0.15
        for: 10m
        labels:
          severity: critical
        annotations:
          summary: "High null rate on {{ $labels.target }}.{{ $labels.field }}"
          description: "{{ $value | humanizePercentage }} of records have null {{ $labels.field }} — possible soft block"

      # Price anomaly spike
      - alert: PriceAnomalySpike
        expr: rate(scraper_price_anomalies_total[10m]) > 0.1
        for: 5m
        labels:
          severity: warning
        annotations:
          summary: "Price anomaly rate spike on {{ $labels.target }}"

      # Proxy success rate degradation
      - alert: ProxySuccessRateLow
        expr: scraper_proxy_success_rate < 0.7
        for: 5m
        labels:
          severity: critical
        annotations:
          summary: "Proxy pool success rate below 70% for {{ $labels.target }}"
          description: "Current rate: {{ $value | humanizePercentage }}"

      # Schema failures — sudden jump suggests layout change
      - alert: SchemaFailureSpike
        expr: rate(scraper_schema_failures_total[5m]) > 1
        for: 5m
        labels:
          severity: warning
        annotations:
          summary: "Schema failure rate elevated on {{ $labels.target }}"
Step 5: Alertmanager Configuration
# alertmanager.yml
global:
  slack_api_url: 'https://hooks.slack.com/services/YOUR/WEBHOOK/URL'

route:
  group_by: ['alertname', 'target']
  group_wait: 30s
  group_interval: 5m
  repeat_interval: 1h
  receiver: 'slack-scraper-alerts'

  routes:
    - match:
        severity: critical
      receiver: 'pagerduty-oncall'

receivers:
  - name: 'slack-scraper-alerts'
    slack_configs:
      - channel: '#scraper-alerts'
        title: 'Scraper Alert: {{ .GroupLabels.alertname }}'
        text: '{{ range .Alerts }}{{ .Annotations.description }}{{ end }}'

  - name: 'pagerduty-oncall'
    pagerduty_configs:
      - routing_key: 'YOUR_PAGERDUTY_KEY'
Step 6: Grafana Dashboard
Provision a dashboard automatically by adding a JSON file to ./grafana/dashboards/. Key panels to include:
Panel 1: Request Success Rate by Target
rate(scraper_requests_total{status_code="200"}[5m]) /
rate(scraper_requests_total[5m])
Panel 2: Null Field Rate Heatmap
scraper_null_field_ratePanel 3: Data Change Rate (Freshness)
scraper_data_change_ratePanel 4: Proxy Pool Success Rate
scraper_proxy_success_ratePanel 5: Records Extracted per Minute
rate(scraper_records_extracted_total[5m]) * 60
Common Pitfalls
Pitfall 1: Scraping Prometheus instead of pushing. For short-lived jobs (one-shot scripts, not long-running services), push metrics to a Pushgateway rather than expecting Prometheus to scrape a /metrics endpoint that may be gone before the next scrape interval.
Pitfall 2: High cardinality labels. Don't use URL as a label value, that creates one time series per unique URL, which can be millions. Keep label cardinality bounded: target, status_code, field, proxy_pool.
Pitfall 3: Alert fatigue. Start with only the critical alerts (stale data, high null rate). Add more only after the critical ones have proven useful. Too many alerts = ignored alerts.
Conclusion
A working Prometheus + Grafana stack for scraping takes a few hours to set up and prevents the class of failures where everything looks fine until it isn't. The null rate alert alone is worth the setup time, it's the metric that catches soft blocks before your downstream consumers do.
Pair this with clean proxy infrastructure from Evomi and you'll see the proxy success rate metrics staying consistently high, a baseline that makes the anomalies meaningful when they do appear. You can test Evomi's proxies with a completely free trial.

Author
The Scraper
Engineer and Webscraping Specialist
About Author
The Scraper is a software engineer and web scraping specialist, focused on building production-grade data extraction systems. His work centers on large-scale crawling, anti-bot evasion, proxy infrastructure, and browser automation. He writes about real-world scraping failures, silent data corruption, and systems that operate at scale.