Why Is My Proxy So Slow? Diagnosing Latency, Bandwidth & Bottlenecks


The Scraper
Proxy Fundamentals
Your scraper ran fine on your laptop. You pointed it at a residential proxy, kicked off the crawl, and now every request takes eight seconds instead of 400 milliseconds. Throughput has fallen off a cliff. The proxy dashboard says everything is healthy. The target loads instantly in your browser. So what is actually slow?
"Slow" is the least useful word in scraping. It hides at least three different problems, and they have different fixes. Before you switch providers or rewrite your client, you need to know which one you have. This post is a diagnostic walkthrough: define the problem precisely, measure each layer, then match the symptom to a cause.
"Slow" Is Three Different Things
People say "slow proxy" and mean one of three measurements. They are not interchangeable.
Latency is the time for a single request's round trip, how long until you get the first byte back. Measured in milliseconds. This is what feels slow when one request hangs.
Throughput (bandwidth) is how much data you move per second across all requests. Measured in MB/s or requests/minute. A pool can have high per-request latency and still give you great throughput if you run enough requests in parallel.
Success rate is the share of requests that return usable data instead of timeouts, resets, or blocks. A 70% success rate feels slow because every retry doubles the effective time, but the network was never the problem.
The trap: you watch one request take eight seconds and conclude the proxy is slow, when your real issue is that you're running them one at a time (a throughput/concurrency problem) or that a third of them are silently retrying (a success-rate problem). Diagnose the right axis first.
The Hops a Request Actually Takes
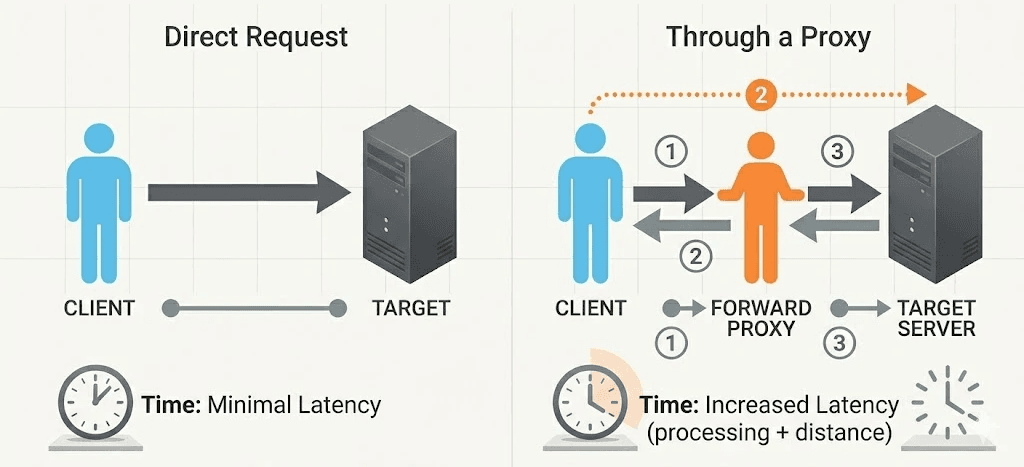
A direct request goes client → target. Through a proxy, it grows extra legs, and each one adds time.
For a residential proxy the path is roughly:
Client → proxy gateway. Your request reaches the provider's entry node. Usually fast and well-provisioned.
Gateway → exit IP. The gateway routes you to an exit. For residential pools, that exit is a real consumer device — a phone or home router somewhere in the world.
Exit (peer device) → target. The peer device makes the actual request to the target site over its own home connection.
Target → back up the chain. The response retraces every hop.
Residential proxies are slower by design, and this is the reason. You are borrowing a stranger's last-mile connection. That peer might be on mobile data, an upstairs Wi-Fi repeater, or a connection already busy with someone's video call. Datacenter proxies skip the consumer device entirely, gateway to a server in a datacenter with fat pipes, which is why they're faster and also why they're easier for targets to identify. The latency you're paying is the cost of looking like a real residential user.
How to Measure It
Stop guessing. Break one request into its phases and see where the time goes. The key distinction is time to first byte (TTFB) versus total time. High TTFB with fast total means the route/handshake is slow. Low TTFB with high total means you're downloading a lot of data (a bandwidth or large-response issue).
Here's a minimal httpx timer that prints DNS, connect, TLS, and TTFB phases:
import time
import httpx

PROXY = "http://user:pass@gateway.example.com:1000"
UA = ("Mozilla/5.0 (Windows NT 10.0; Win64; x64) AppleWebKit/537.36 "
      "(KHTML, like Gecko) Chrome/148.0.0.0 Safari/537.36")

events = {}

def stamp(label):
    events[label] = time.perf_counter()

start = time.perf_counter()
with httpx.Client(proxy=PROXY, headers={"User-Agent": UA}, timeout=30) as client:
    with client.stream("GET", "https://httpbin.org/get") as r:
        ttfb = time.perf_counter() - start
        body = r.read()
        total = time.perf_counter() - start

print(f"TTFB:  {ttfb*1000:7.0f} ms")
print(f"Total: {total*1000:7.0f} ms")
print(f"Body:  {len(body)} bytes  ({len(body)/total/1024:.0f} KB/s)")
If TTFB is most of your total time, the slowness is in the route and handshake, not the download. To split that out further, DNS vs TCP connect vs TLS, curl has a built-in timing template that's quicker than instrumenting Python:
curl -o /dev/null -s -x http://user:pass@gateway.example.com:1000 \
  -w "dns:      %{time_namelookup}s\nconnect:  %{time_connect}s\ntls:      %{time_appconnect}s\nttfb:     %{time_starttransfer}s\ntotal:    %{time_total}s\n" \
  https://httpbin.org/get
Run that a dozen times against the same target. Watch the spread. Consistent 2s TTFB is a routing/distance problem. Wildly varying TTFB, 400ms, then 6s, then 1s, points at an oversubscribed pool or a slow pinned peer, which is the single most common real cause.
Common Real Causes —> A Checklist
Work down this list in order. Most "slow proxy" tickets resolve in the first three.
Oversubscribed / overloaded pool. Too many customers sharing too few exits. The classic symptom is high variance, fast then slow then fast. A clean, well-sized residential pool, like Evomi's, exists largely to avoid this; budget pools that resell the same IPs to everyone do not.
Geographically distant exit. You're in Frankfurt, scraping a US site, routed through an exit in Brazil. Three continents of round trips per request. Pin the exit region close to the target.
Sticky session pinned to a slow peer. Sticky sessions keep you on one exit IP for consistency, great for logins, terrible if that one device is on a weak connection. You're stuck with it until the session rotates.
DNS resolution path. If DNS is resolved at the exit over a slow link, or you're not reusing resolutions,
time_namelookupballoons. Thecurltemplate above shows this directly.Target-side throttling disguised as slowness. The site sees your request rate and deliberately delays responses (tarpitting) or rate-limits you with slow 429-then-retry loops. This looks like proxy latency but the proxy is innocent, the target is pacing you. Check whether direct requests to the target are also slow.
No keep-alive / no gzip. Opening a fresh TCP+TLS connection per request adds a full handshake every time. Not sending
Accept-Encoding: gzipmeans downloading uncompressed HTML, pure wasted bandwidth.Concurrency mismatch. Too low and you leave the pipe empty (low throughput despite fine latency). Too high and you congest the gateway, the peer, or trip the target's rate limits, which then throttles you, looping back to cause #5.
Residential vs ISP vs Datacenter: The Speed Tradeoff
The proxy type you chose sets your latency floor before you tune anything.
Datacenter. Fastest and cheapest per GB. Server-to-server, no consumer last mile. Latency often near-direct. The tradeoff is identifiability, these IPs are easy for targets to recognize as non-residential.
ISP (static residential). IPs registered to consumer ISPs but hosted in datacenters. You get residential-looking addresses with datacenter-grade speed and stability. The middle ground, and usually the right answer when speed matters and you don't need a huge rotating pool.
Residential (rotating). Real peer devices on real home connections. The most authentic-looking, and the slowest and most variable by nature. You pay latency for legitimacy.
Mobile. Routed through cellular networks. Highly trusted by targets, but the highest and most variable latency of all, carrier networks add their own hops and congestion.
If your workload is latency-sensitive and the target tolerates it, ISP proxies often beat rotating residential by a wide margin. Don't reach for residential reflexively.
Tuning: What Actually Helps
Once you know which axis is slow, these are the levers:
Reuse connections. Use a single
httpx.Clientorrequests.Sessionfor the whole run so keep-alive and TLS sessions are reused. This alone can halve effective latency on multi-request crawls.Size concurrency to the bottleneck. Start around 10-20 concurrent requests, watch throughput and success rate, and increase only while both hold. The moment success rate dips or TTFB climbs, you've found the ceiling, back off.
Pick a closer region. Match the exit region to the target's location. Cutting two continents out of the path is the biggest single latency win available.
Rotate off slow exits. If a sticky session lands on a sluggish peer, drop it and request a new one rather than waiting it out. Set a per-request TTFB budget and treat a breach as a signal to rotate.
Set sane timeouts. A 30s timeout means one bad peer stalls a worker for 30 seconds. A 10s connect / 15s read timeout with a retry on a fresh exit usually gives better real throughput than patiently waiting.
Always request gzip.
Accept-Encoding: gzip, deflate, br. Free bandwidth on text-heavy pages.
Mistakes That Waste Time
Blaming the proxy before measuring. Run the timing template first. Half the time the target is the slow one.
Cranking concurrency to "fix" slowness. More parallelism doesn't fix high latency, and past the ceiling it actively makes things worse by congesting the path and tripping rate limits.
Testing against
httpbin.organd shipping to a real target. A diagnostic endpoint tells you proxy-side latency only. Your real target adds its own throttling behavior.Comparing proxy speed to your direct connection. A proxy will always be slower than direct. The right comparison is proxy-vs-proxy under the same conditions.
Leaving sticky sessions on when you don't need session continuity. You're voluntarily pinning yourself to one possibly-slow device.
Opening a new client per request. You pay a full TLS handshake every time. Reuse the session.
Wrapping Up
Before you switch providers, do two things. First, separate the three meanings of "slow": measure latency (TTFB), throughput, and success rate independently, the fix for one won't touch the others. Second, run the curl timing template a dozen times against your real target; consistent high TTFB means a distant or congested route, while wild variance means an oversubscribed pool or a slow pinned peer. Fix those two and most "slow proxy" problems disappear without spending a cent more on bandwidth.
Your scraper ran fine on your laptop. You pointed it at a residential proxy, kicked off the crawl, and now every request takes eight seconds instead of 400 milliseconds. Throughput has fallen off a cliff. The proxy dashboard says everything is healthy. The target loads instantly in your browser. So what is actually slow?
"Slow" is the least useful word in scraping. It hides at least three different problems, and they have different fixes. Before you switch providers or rewrite your client, you need to know which one you have. This post is a diagnostic walkthrough: define the problem precisely, measure each layer, then match the symptom to a cause.
"Slow" Is Three Different Things
People say "slow proxy" and mean one of three measurements. They are not interchangeable.
Latency is the time for a single request's round trip, how long until you get the first byte back. Measured in milliseconds. This is what feels slow when one request hangs.
Throughput (bandwidth) is how much data you move per second across all requests. Measured in MB/s or requests/minute. A pool can have high per-request latency and still give you great throughput if you run enough requests in parallel.
Success rate is the share of requests that return usable data instead of timeouts, resets, or blocks. A 70% success rate feels slow because every retry doubles the effective time, but the network was never the problem.
The trap: you watch one request take eight seconds and conclude the proxy is slow, when your real issue is that you're running them one at a time (a throughput/concurrency problem) or that a third of them are silently retrying (a success-rate problem). Diagnose the right axis first.
The Hops a Request Actually Takes
A direct request goes client → target. Through a proxy, it grows extra legs, and each one adds time.
For a residential proxy the path is roughly:
Client → proxy gateway. Your request reaches the provider's entry node. Usually fast and well-provisioned.
Gateway → exit IP. The gateway routes you to an exit. For residential pools, that exit is a real consumer device — a phone or home router somewhere in the world.
Exit (peer device) → target. The peer device makes the actual request to the target site over its own home connection.
Target → back up the chain. The response retraces every hop.
Residential proxies are slower by design, and this is the reason. You are borrowing a stranger's last-mile connection. That peer might be on mobile data, an upstairs Wi-Fi repeater, or a connection already busy with someone's video call. Datacenter proxies skip the consumer device entirely, gateway to a server in a datacenter with fat pipes, which is why they're faster and also why they're easier for targets to identify. The latency you're paying is the cost of looking like a real residential user.
How to Measure It
Stop guessing. Break one request into its phases and see where the time goes. The key distinction is time to first byte (TTFB) versus total time. High TTFB with fast total means the route/handshake is slow. Low TTFB with high total means you're downloading a lot of data (a bandwidth or large-response issue).
Here's a minimal httpx timer that prints DNS, connect, TLS, and TTFB phases:
import time
import httpx

PROXY = "http://user:pass@gateway.example.com:1000"
UA = ("Mozilla/5.0 (Windows NT 10.0; Win64; x64) AppleWebKit/537.36 "
      "(KHTML, like Gecko) Chrome/148.0.0.0 Safari/537.36")

events = {}

def stamp(label):
    events[label] = time.perf_counter()

start = time.perf_counter()
with httpx.Client(proxy=PROXY, headers={"User-Agent": UA}, timeout=30) as client:
    with client.stream("GET", "https://httpbin.org/get") as r:
        ttfb = time.perf_counter() - start
        body = r.read()
        total = time.perf_counter() - start

print(f"TTFB:  {ttfb*1000:7.0f} ms")
print(f"Total: {total*1000:7.0f} ms")
print(f"Body:  {len(body)} bytes  ({len(body)/total/1024:.0f} KB/s)")
If TTFB is most of your total time, the slowness is in the route and handshake, not the download. To split that out further, DNS vs TCP connect vs TLS, curl has a built-in timing template that's quicker than instrumenting Python:
curl -o /dev/null -s -x http://user:pass@gateway.example.com:1000 \
  -w "dns:      %{time_namelookup}s\nconnect:  %{time_connect}s\ntls:      %{time_appconnect}s\nttfb:     %{time_starttransfer}s\ntotal:    %{time_total}s\n" \
  https://httpbin.org/get
Run that a dozen times against the same target. Watch the spread. Consistent 2s TTFB is a routing/distance problem. Wildly varying TTFB, 400ms, then 6s, then 1s, points at an oversubscribed pool or a slow pinned peer, which is the single most common real cause.
Common Real Causes —> A Checklist
Work down this list in order. Most "slow proxy" tickets resolve in the first three.
Oversubscribed / overloaded pool. Too many customers sharing too few exits. The classic symptom is high variance, fast then slow then fast. A clean, well-sized residential pool, like Evomi's, exists largely to avoid this; budget pools that resell the same IPs to everyone do not.
Geographically distant exit. You're in Frankfurt, scraping a US site, routed through an exit in Brazil. Three continents of round trips per request. Pin the exit region close to the target.
Sticky session pinned to a slow peer. Sticky sessions keep you on one exit IP for consistency, great for logins, terrible if that one device is on a weak connection. You're stuck with it until the session rotates.
DNS resolution path. If DNS is resolved at the exit over a slow link, or you're not reusing resolutions,
time_namelookupballoons. Thecurltemplate above shows this directly.Target-side throttling disguised as slowness. The site sees your request rate and deliberately delays responses (tarpitting) or rate-limits you with slow 429-then-retry loops. This looks like proxy latency but the proxy is innocent, the target is pacing you. Check whether direct requests to the target are also slow.
No keep-alive / no gzip. Opening a fresh TCP+TLS connection per request adds a full handshake every time. Not sending
Accept-Encoding: gzipmeans downloading uncompressed HTML, pure wasted bandwidth.Concurrency mismatch. Too low and you leave the pipe empty (low throughput despite fine latency). Too high and you congest the gateway, the peer, or trip the target's rate limits, which then throttles you, looping back to cause #5.
Residential vs ISP vs Datacenter: The Speed Tradeoff
The proxy type you chose sets your latency floor before you tune anything.
Datacenter. Fastest and cheapest per GB. Server-to-server, no consumer last mile. Latency often near-direct. The tradeoff is identifiability, these IPs are easy for targets to recognize as non-residential.
ISP (static residential). IPs registered to consumer ISPs but hosted in datacenters. You get residential-looking addresses with datacenter-grade speed and stability. The middle ground, and usually the right answer when speed matters and you don't need a huge rotating pool.
Residential (rotating). Real peer devices on real home connections. The most authentic-looking, and the slowest and most variable by nature. You pay latency for legitimacy.
Mobile. Routed through cellular networks. Highly trusted by targets, but the highest and most variable latency of all, carrier networks add their own hops and congestion.
If your workload is latency-sensitive and the target tolerates it, ISP proxies often beat rotating residential by a wide margin. Don't reach for residential reflexively.
Tuning: What Actually Helps
Once you know which axis is slow, these are the levers:
Reuse connections. Use a single
httpx.Clientorrequests.Sessionfor the whole run so keep-alive and TLS sessions are reused. This alone can halve effective latency on multi-request crawls.Size concurrency to the bottleneck. Start around 10-20 concurrent requests, watch throughput and success rate, and increase only while both hold. The moment success rate dips or TTFB climbs, you've found the ceiling, back off.
Pick a closer region. Match the exit region to the target's location. Cutting two continents out of the path is the biggest single latency win available.
Rotate off slow exits. If a sticky session lands on a sluggish peer, drop it and request a new one rather than waiting it out. Set a per-request TTFB budget and treat a breach as a signal to rotate.
Set sane timeouts. A 30s timeout means one bad peer stalls a worker for 30 seconds. A 10s connect / 15s read timeout with a retry on a fresh exit usually gives better real throughput than patiently waiting.
Always request gzip.
Accept-Encoding: gzip, deflate, br. Free bandwidth on text-heavy pages.
Mistakes That Waste Time
Blaming the proxy before measuring. Run the timing template first. Half the time the target is the slow one.
Cranking concurrency to "fix" slowness. More parallelism doesn't fix high latency, and past the ceiling it actively makes things worse by congesting the path and tripping rate limits.
Testing against
httpbin.organd shipping to a real target. A diagnostic endpoint tells you proxy-side latency only. Your real target adds its own throttling behavior.Comparing proxy speed to your direct connection. A proxy will always be slower than direct. The right comparison is proxy-vs-proxy under the same conditions.
Leaving sticky sessions on when you don't need session continuity. You're voluntarily pinning yourself to one possibly-slow device.
Opening a new client per request. You pay a full TLS handshake every time. Reuse the session.
Wrapping Up
Before you switch providers, do two things. First, separate the three meanings of "slow": measure latency (TTFB), throughput, and success rate independently, the fix for one won't touch the others. Second, run the curl timing template a dozen times against your real target; consistent high TTFB means a distant or congested route, while wild variance means an oversubscribed pool or a slow pinned peer. Fix those two and most "slow proxy" problems disappear without spending a cent more on bandwidth.

Author
The Scraper
Engineer and Webscraping Specialist
About Author
The Scraper is a software engineer and web scraping specialist, focused on building production-grade data extraction systems. His work centers on large-scale crawling, anti-bot evasion, proxy infrastructure, and browser automation. He writes about real-world scraping failures, silent data corruption, and systems that operate at scale.


