


For website change detection in Python, you run a scheduled job. That job is called a change monitor. The monitor fetches a page, checks whether anything you care about changed, and delivers only that change to your alerts. You plan the fetch. The decision step is usually a hash of the response body, with 2 failure modes. On many pages, the hash moves on every poll with nothing changed. But on others, the hash stays the same, because a challenge page replaced the page and still returned 200. This guide builds one in Python on the Evomi Scraper API.
TL;DR
- Raw HTML can alert on per-render markup. A span is one stretch that the diff flagged. One page gave 298 changed spans per poll, with nothing changed. Markdown gave 0.
- Treat HTTP 200 as a response arriving, not a page loading. A challenge page stayed byte-identical at 200, and
refusedescalated to the browser step. - Ask the origin first. Conditional requests got 304 from a JSON API and a static file, and got 200 every time from proxied rendered HTML.
- Classify before escalating. A 404 costs 1 credit, and an unclassified retry spends 8 credits across 3 steps.
What a monitoring agent actually spends money on
When you budget for a monitor, your first instinct is to price the fetch. But against the model cost, the fetch is the part that varies least.
One screen shows the choices that set cost and noise:
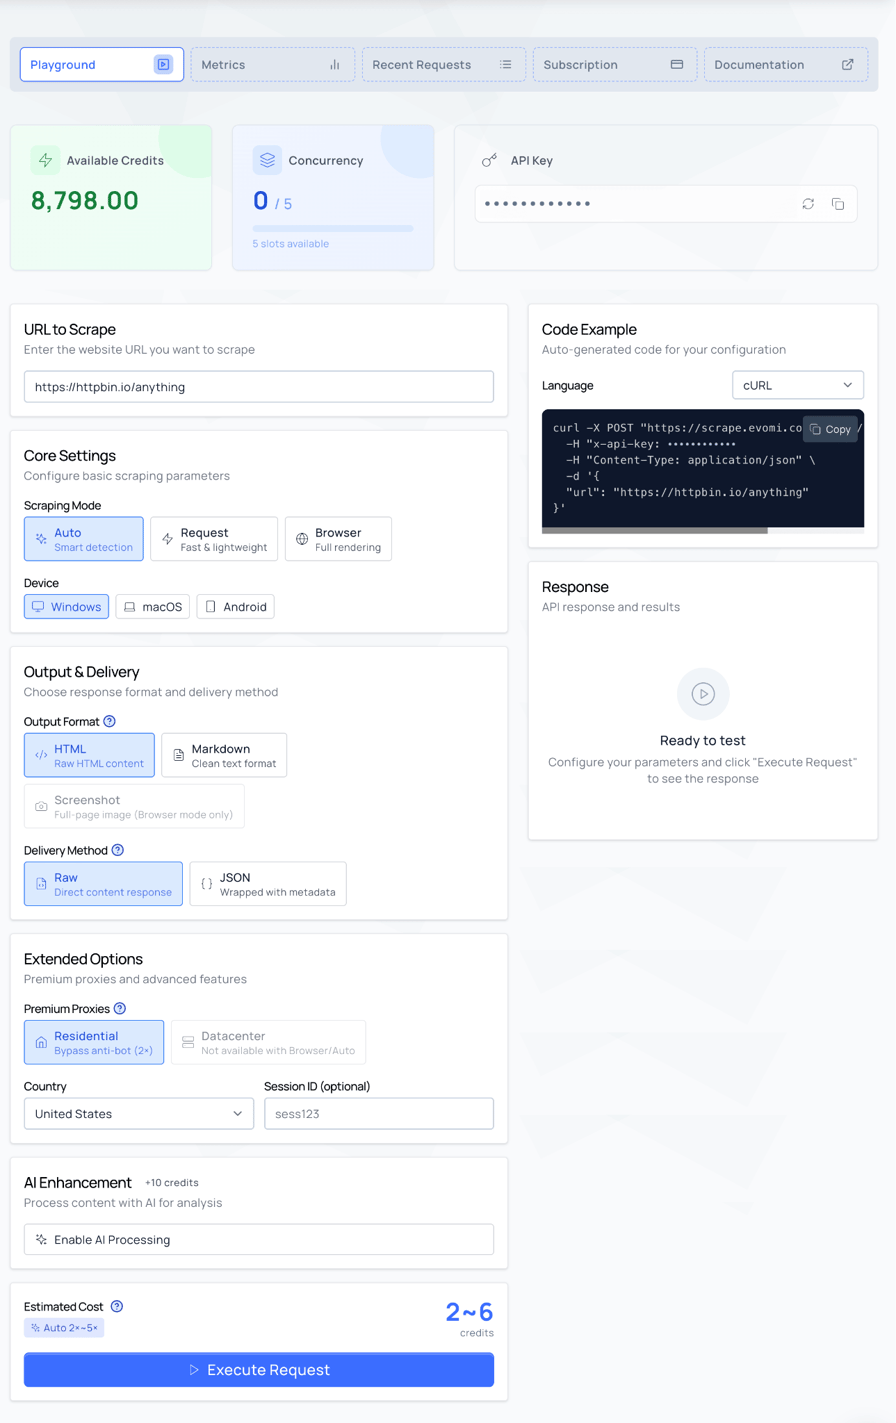
Four of those settings matter here. Output format controls how much noise is in your diff. Scraping mode and proxy type set what a poll costs. Delivery method sets whether you get a parsed envelope or raw text.
The Scraper API charges per request, not by page weight. An HTTP fetch over datacenter proxies costs 1 credit, the same fetch over residential proxies costs 2, and a full browser render costs 5. A billed response carries its cost in an x-credits-used header, and an accepted task carries credits_reserved instead.
Auto picks the path per request, so it estimates a range of 2~6 credits. Reserve against that range, or pin the mode, and budget against a single number.
Monitors often send the change to a language model, so a person gets a summary, or an LLM agent reads the output. Your bill depends on what you send the model, and how often you send it. The Playwright releases page measured 495,992 bytes of HTML.
o200k_base counted the releases page at 170,170 tokens. The same page as markdown was 12,481, and as named fields it was 222. The raw page carries 767 times the tokens of the fields. Vendors count with their own tokenizers, so treat the ratios as durable and count your own tokens before you budget.
The measured numbers here are first-party. Most of them were taken on Evomi's Scraper API. Live pages keep changing, so rerun anything you plan to budget against. Re-check the plan table below against the Scraper API product page, since every price here was read on 12 September 2026.
All 3 shapes cost the same 1 credit to fetch, because the fetch price includes the markdown conversion and the selector work. They don't cost the same to read, at 200 pages polled hourly against Sonnet 5 input pricing of $2.00 per million tokens:
What each poll sends to the model | Cost per month, 200 pages hourly on Sonnet 5 |
|---|---|
Raw HTML, every poll | $49,008.96 |
Markdown, every poll | $3,594.53 |
Extracted fields, every poll | $63.94 |
Extracted fields, only when they changed | $0.27, at 3 changes a month |
The fetch is separate. At 144,000 polls a month, the fetch costs $28.80 on pay-as-you-go at $0.20 per 1,000 credits. A plan bills its price rather than a per-credit total, because plans are fixed allowances. These were the published tiers on September 2026:
Evomi Scraper API plan | Per month, September 2026 | Credits included | Concurrent requests |
|---|---|---|---|
Pay as you go | on demand | on demand, at $0.20 per 1,000 | 10 |
Developer | $44.99 | 275,000 | 25 |
Startup | $149.99 | 1,050,000 | 55 |
Business | $379.99 | 2,925,000 | 105 |
Those 144,000 polls fit inside the Developer allowance and still cost less on pay-as-you-go. A plan earns its discount only once you use most of it. Developer overtakes pay-as-you-go at about 225,000 credits a month. The concurrency column is the other reason to move, and the scheduling section below is where it decides something. A free trial key runs at 5, below the lowest row here.
That arithmetic assumes that every poll stays on the 1-credit HTTP path, and the last row assumes 3 content changes per page per month. When a browser render serves a target, each poll costs 5 credits, and your agent stores the step that served it. Measure your own change rate and price your own mix before picking a plan.
The model column spans 5 orders of magnitude, and your detector changes that column. Price the decision, not the fetch.
How a poll returns nothing and reports success
A monitor runs unattended, so it needs a definition of success that a machine can check. The status code isn't that definition. The cases below all arrived as well-formed responses, and 3 of the 4 arrived as HTTP 200. Each of the 4 carried something other than the page you asked for.
The challenge page. One poll of a subreddit on auto mode took the HTTP path, returned 200, cost 2 credits, and delivered 166,558 bytes. The title was Reddit - Prove your humanity, and the body contained 0 posts. Two polls 8 seconds apart returned identical bytes. A browser render serves the subreddit.
Rendering the bytes that came back shows what the monitor actually got:

The byte-identical result matters more than the challenge itself. A hash detector reads byte-identical responses as "nothing changed" and keeps reading them that way. That challenge page was more stable than the content it replaced, so the failure looked healthier than the healthy state.
The unrendered page. The client-rendered company directory at ycombinator.com arrives complete on browser mode, and its 184,898 bytes contain the names. The page calls a search API while it renders. That API carried all 1,000 records.
On auto mode, the HTTP path returned what the server sends before JavaScript runs. That response was 35,062 bytes of unrendered markup. Nothing fails at the transport level, so your completeness check has to catch the missing rows. min_rows below sets that check.
The same pattern appears on a page you can try yourself. quotes.toscrape.com/js builds its list in the browser. The HTTP path returns a page whose 10 quotes are inside a script tag, and they appear nowhere in the markup your selectors read:
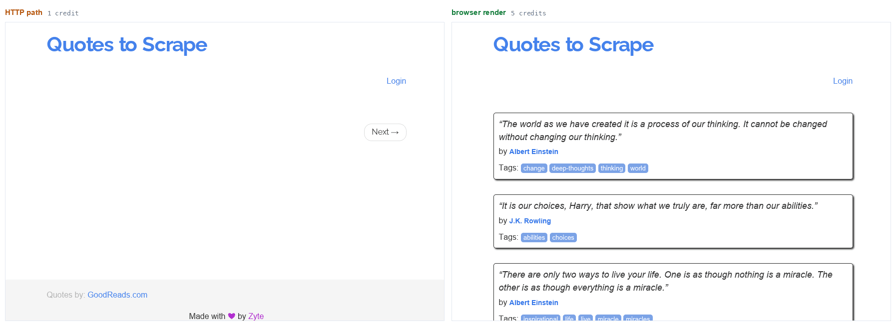
Both calls returned 200. The browser render cost 5 credits for 8,734 bytes and all 10 quotes. The HTTP call cost 1 credit for 5,596 bytes of pre-JavaScript markup.
If a monitor points at the HTTP call, it records a stable fingerprint of an empty page. It reports that nothing is changing, which is true of the bytes it received and not of the page.
The page that arrives as a handle. A long scrape becomes a task. The realtime endpoint answers with the handle, so the work can continue past the request:
{"task_id": "290c63ad-...", "status": "processing", "success": true,
 "credits_reserved": 1, "check_url": "/api/v1/scraper/tasks/290c63ad-...",
 "message": "Task is taking longer than 30 seconds. Use the check url to check status."}
That handle arrives with HTTP 202. When concurrency is high, a plain realtime call can answer with a handle too. A caller that reads every non-200 as a transport failure discards a page it has already paid for.
Once the task finished, fetching that check_url returned the page in the same shape a direct call returns. The page was 51,958 characters. Follow the handle rather than treating an absent content field as a broken target, so you use the poll you've already bought.
Two statuses in one response. The API reports its own transport status in the HTTP response and the origin's status in the body. A travel booking front page came back as HTTP 200 wrapping an origin 202. A URL that doesn't exist came back as HTTP 200 wrapping a 404, with 294,576 bytes of error page. If your caller reads only the outer status, it records a dead URL as a healthy target.
Each of those failures has a name, and the classifier below assigns it. Before the classifier can name a failure, though, you have to decide what you're comparing.
Three layers of website change detection in Python, weakest dependency first
Fetch on a schedule, then extract the fields you care about into structured JSON. Sort and fingerprint them, compare the fingerprint against the previous poll, and alert only when the fingerprint moves.
A hash of the whole response depends on more of the page than any of the 3 layers below. Each removes a different class of false alert, and its dependency is weaker than the one after it. Markdown and extraction each take 1 parameter on the Scraper API, and it passes your validator header through for the conditional request. Whether that header earns a 304 is the origin's answer rather than the API's, and the table below shows which targets gave one.
The noise measurements come from a release page and a news page, each on a 1-credit fetch. The conditional-request round adds a JSON API and a static file, because a validator tells you something only across several targets.
The Playwright release list is a typical example of what people watch, a repeating block that gains an entry when something ships:
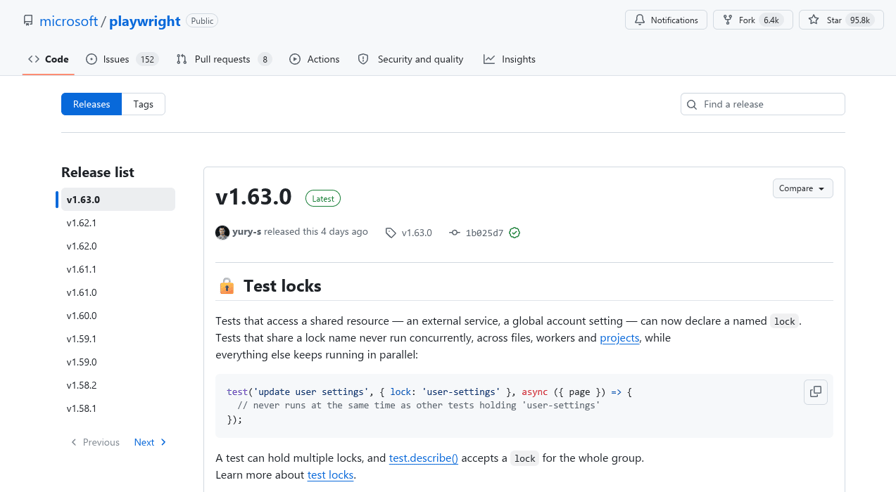
The 10 versions in that sidebar are the 10 rows that the extraction scheme returns. The tag beside each version is one of the fields that the fingerprint uses.
Each layer was measured on the targets above, one at a time:
Layer | Depends on | Removes | Measured |
|---|---|---|---|
Ask the origin | what HTTP guarantees | the whole poll, when the validator is stable | JSON API and static file answered |
Compare text, not markup | the page's text | nonces, request ids, per-render accessibility ids | on one release page, raw HTML 298 changed spans per poll, markdown 0 |
Extract named fields | the selectors you name | text that moves on its own, once you name the field volatile | a news page still moved 4 spans as markdown 150 seconds apart, and on the release page extract gave 0 and cut 12,481 |
The ordering is by dependency rather than price. A 304 sits at the top and costs the same flat per-request credit as everything below it. The agent built below uses the bottom row, so its diff never sees the markup the middle row removes.
Ask the origin
A conditional request sends back the ETag that you last saw, as If-None-Match. When a server recognizes the ETag, it answers 304 Not Modified with an empty body.
The Scraper API passes the header through, so a conditional request works from behind a proxy. Confirm one 304 on a target before trusting the branch, since a dropped header and a moved validator both arrive as 200. API and KEY arrive with the agent, so the block below is the shape of the 2 calls rather than code to run:
first  = {"url": url, "delivery": "json", "capture_headers": True,
          "mode": "request", "proxy_type": "datacenter"}
fetched = httpx.post(API, headers={"x-api-key": KEY}, json=first).json()
etag   = fetched["headers"]["response_headers"].get("etag")

later  = {**first, "additional_headers": {"If-None-Match": etag}}
# a 304 arrives as status_code 304 inside the payload, with no content
The agent below omits this layer. To add it, put the 304 branch ahead of the body checks in classify, since a 304 arrives with an empty body. Have that branch record the time of the fetch, the same as any successful poll does. A 304 that records nothing looks like a target that has stopped reporting.
ETag isn't the only validator. A target that sends Last-Modified instead accepts the date back as If-Modified-Since, and on books.toscrape.com, both headers returned 304 on 3 consecutive tries. Both arrive in the same capture_headers dict, so checking for either costs nothing extra. Treat Last-Modified as the fallback rather than your first choice, since only 1 of 5 targets in a separate survey offered it.
Each target got 5 rounds, where every round fetches once, reads the ETag, then re-requests with it:
target                             distinct ETags   conditional result
GitHub releases (rendered HTML)         5 of 5         200, 200, 200, 200, 200
GitHub API (JSON)                       1 of 5         304, 304, 304, 304, 304
books.toscrape (static file)            1 of 5         304, 304, 304, 304, 304
Fetched directly from a single address, the rendered page holds one ETag across 3 tries and answers 304 to it. Going through the proxy pool is what changes. Pinning the exit with proxy_session_id doesn't recover it either: across 4 rounds on one session, the validator still moved and every conditional answered 200. So the exit address isn't the variable, and these rounds didn't isolate which one is. Treat the 304 as unavailable on this path rather than as something to tune.
Use a validator where the table shows it works, on a JSON API or a static file. Compare the body on a rendered page.
A 304 confirms from the origin that nothing changed, and it saves bandwidth. Bandwidth matters when you run your own fetcher over raw proxies and pay by the gigabyte. Under the per-request billing above, 1 credit covered a 495,992-byte page and a 5,596-byte one alike. A 304 removes everything after the fetch: the diff, the stored payload and the model call.
Before building any detector, check whether your target has a machine-readable version at all.
Many pages have no API of their own, and they still call one while they render. The company directory above fetches its listings from a search API. Browser mode captures that call when asked, with networkCapture filtered to the API's host. That parameter accepted up to 10 filters when this was checked. Two consecutive polls:
captured     45bwzj1sgc-dsn.algolia.net/1/indexes/*/queries
body         2,647,313 bytes, 1,000 records, 29 fields each
records      identical across both polls, 0 of 29 fields moved
envelope     processingTimeMS, serverTimeMS, processingTimingsMS moved
credits      5, the browser render
The body arrives base64-encoded, and the envelope carries the API's own timings, so hash the records and not the envelope. That capture returns the whole dataset behind the page, not the part the page renders. You write no selector against the page, so a restyle breaks nothing you wrote. The host filter above is what you maintain instead. That host is the app id this site used on the day it was read, so take your own off the browser's network tab. It stops matching if the page changes which API it calls, and the API's own response shape can move under you too.
Compare text, not markup
When the origin has no usable validator, choose what you compare. The output format is 1 setting, and HTML is the default that gives you the page as served:
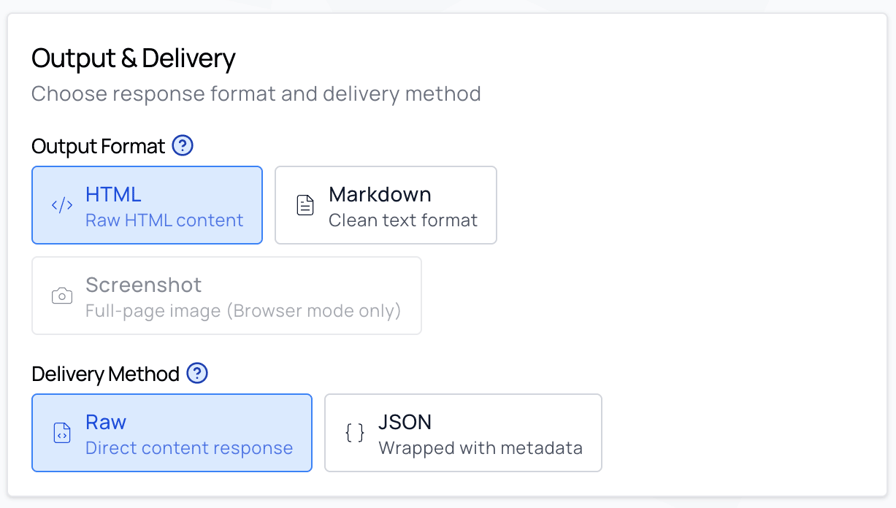
Asking the same endpoint for markdown instead of HTML costs the same 1 credit. Where the noise sits in attributes, the conversion drops it. A span here is one difflib opcode over the token-split responses:
poll   raw HTML                          markdown
1      298 spans, similarity 0.98891     0 spans, similarity 1.0
2      298 spans, similarity 0.98891     0 spans, similarity 1.0
3      298 spans, similarity 0.98891     0 spans, similarity 1.0
No release shipped during that window. Every one of those 298 spans is per-render markup, and the diff shows which kinds:
- data-nonce="v2:26ef7039-f55f-7751-7e56-1adf72f3eca2"
+ data-nonce="v2:34a4451c-6dcc-1e3b-fd42-c033cd67874c"

- aria-labelledby="tooltip-8421dd70-a009-49b9-80a5-c9ddaccd7494"
+ aria-labelledby="tooltip-d825b8ee-83f7-468b-996c-4c5951d84d5e"

- id="icon-button-abae2aab-25a7-4376-9e31-d69454c9bb9f"
+ id="icon-button-49092f99-d186-4c69-bf8f-2f9b6a45300a"
On this page, nonces, request ids and per-render accessibility ids were all in attributes. Markdown conversion carries the text and drops the attributes, so the entire class disappears without a single selector.
Of the 298 spans, 235 carried a new UUID. A hand-written filter matched only 23 of the 298. That filter covered CSRF tokens, nonces, session ids, timestamps and long hex strings, and it didn't cover dashed UUIDs.
Adding a UUID pattern wasn't tried, because a pattern filter covers only the noise you thought to write down. Changing one parameter is cheaper, and the approach generalizes to sites that put their noise somewhere else.
JSON delivery hands you the content and the page's meta tags side by side, as a meta object. The meta object is useful for titles and descriptions. A site can also keep its per-render values there, so hash the content field. Two polls 20 seconds apart:
content          13293ad638ec   13293ad638ec   same
meta             77a8701ffbe1   de207a38ed67   5 of 51 keys moved
whole payload    418f1429c7a4   4853c58baddf   changed
The 5 were fetch-nonce, html-safe-nonce, request-id, visitor-hmac and visitor-payload. All 5 come from GitHub, and all 5 are per-render values. Hash the field you asked for. The envelope around it isn't the value you monitor.
Extract named fields
Markdown carries the page's text, and some of that text moves on its own. The BBC news front page as markdown, 150 seconds apart:
4 spans, similarity 0.99767
  '37' -> '40'    '12' -> '13'
  '19' -> '20'    '11' -> '14'
Those 4 spans are relative-timestamp counts rendered into the prose, and the markdown layer keeps them because they're content. All 24 timestamps on that page are in a span that carries data-testid="card-metadata-lastupdated". excluded_selectors keeps that element out of the markdown, for the same 1 credit. Two later runs each diffed two fetches 150 seconds apart. The first ran without the exclusion, and the second ran with it:
150 s apart, markdown             5 spans, all timestamp numerals
150 s apart, span excluded        'ago' 24 to 0, 5 spans, all headlines
Those 2 counts are both 5 by coincidence, and the exclusion's evidence is the 'ago' count going from 24 to 0. The 5 spans that remained were one story changing: the Arsenal headline left the page, and a Crystal Palace one replaced it. That change is the alert you want. A live page gives a different count on every run, so read the class of change, not the number. When the noise has a selector, excluding it is the cheaper fix.
An extraction scheme gives you 2 more things beyond exclusion. It cuts the release page's payload further, and it produces a delta you can read rather than a boolean. A scheme is a list of buckets, and each root entry is a nest whose selector matches the repeating element:
[
  {
    "label": "releases",
    "type": "nest",
    "selector": "section[aria-labelledby]",
    "fields": [
      { "label": "tag",       "type": "content", "selector": "h2.sr-only" },
      { "label": "published", "type": "content", "selector": "relative-time" },
      { "label": "is_latest", "type": "exists",  "selector": "span.Label--success" }
    ]
  }
]
That scheme returns 10 rows of {tag, published, is_latest}. The exists type gives a boolean without needing the element's text. That type suits badges like "Sold out" or "Latest".
From here, you need a page of your own to watch.
Writing a scheme against that page takes 4 steps in the browser's inspector:
- Right-click one item and inspect it.
- Walk up the tree to the nearest ancestor that repeats once per item.
- Confirm that ancestor in the console with
document.querySelectorAll('your-selector').length, which should equal the number of items you can count on the page. That selector is thenest. - Inspect each value you want inside one item and name it as a field.
The screenshot below outlines that scheme on the page it targets:
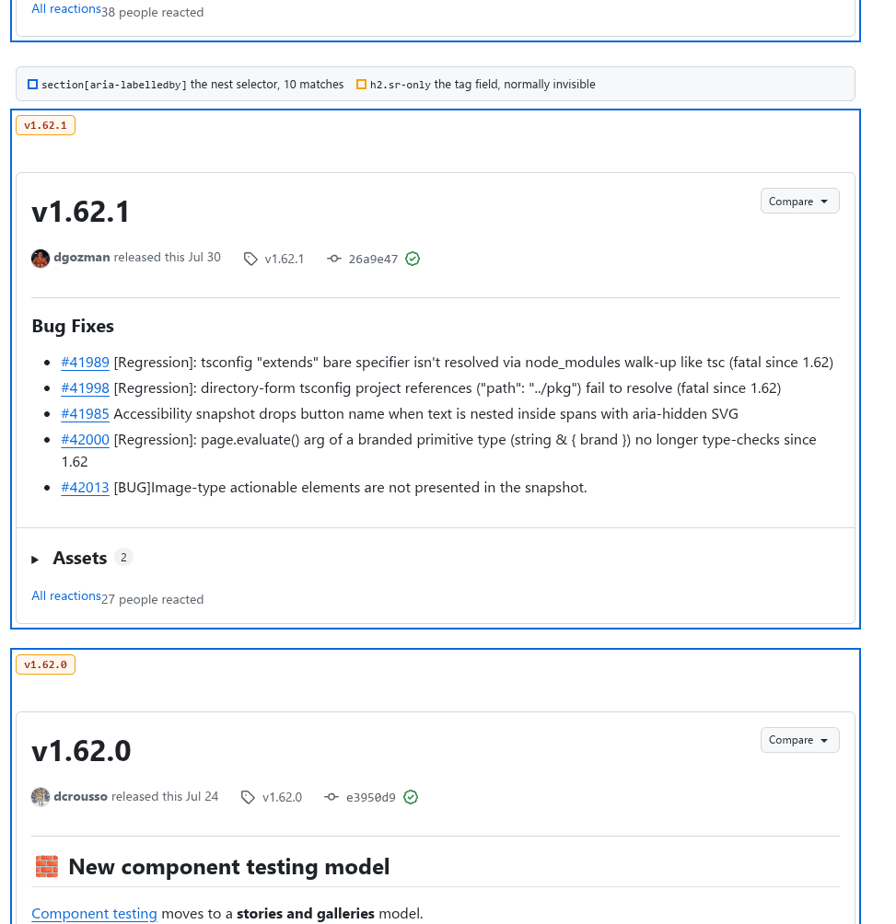
Those outlines aren't on the page. h2.sr-only is invisible in a normal render. A selector can be the most stable thing on the page and still be something you can't see while inspecting it. Stable is a bet either way, which is what the completeness check is for.
Send the scheme to POST /account/schemes with test: true to confirm you found the selector. That test runs against the live URL and returns the rows.
Another 2 steps make the fingerprint stable enough to trust:
import hashlib, json

def stable(rows, volatile):
    """Strip fields that move on their own, then sort so a reshuffle cannot fire an alert."""
    kept = [{k: v for k, v in r.items() if k not in volatile} for r in rows]
    kept.sort(key=lambda r: json.dumps(r, sort_keys=True))
    return kept, hashlib.sha256(json.dumps(kept, sort_keys=True).encode()).hexdigest()
Many listings reorder without changing membership, and an unsorted hash fires an alert on every reshuffle. Naming published as volatile also records the decision, so a reviewer can see what you dropped.
Building the change detector in Python
Your agent is a pipeline, and the order of its stages is the decision that matters. Nothing expensive runs until the cheap checks have passed.
- Arrival. Did a page come back, or a challenge page carrying a 200?
- Identity. Is it the page you asked for, or a country splash page after a redirect?
- Completeness. Did the selectors find rows, at roughly the count you expect?
- Change. Does the canonical fingerprint differ from the stored one?
Each of your targets gets a config that records what healthy looks like:
{
  "url": "https://github.com/microsoft/playwright/releases",
  "min_rows": 5,
  "required_fields": ["tag"],
  "volatile_fields": ["published"],
  "expect_text": "Releases",
  "extract_scheme": [
    {
      "label": "releases",
      "type": "nest",
      "selector": "section[aria-labelledby]",
      "fields": [
        { "label": "tag",       "type": "content", "selector": "h2.sr-only" },
        { "label": "published", "type": "content", "selector": "relative-time" }
      ]
    }
  ]
}
This config drops the is_latest field from the scheme above, because a new tag already moves the fingerprint. Add it back when the badge is the thing you watch.
min_rows, required_fields and expect_text are the health checks written down. Your agent matches expect_text against the first 8,000 characters, so pick a string that appears early and holds still when the value moves.
A product title survives a sell-out, so it makes a good expect_text. Avoid "Add to Cart", which disappears with the stock, so the check would stop the poll at the moment you want the alert. A page normally returns 10 releases. When it suddenly returns 1, it's more likely reporting a problem than a change.
monitor.py is 8 blocks, and the last 3 are under a heading that a single-target reader would otherwise skip:
1  stable()                                     Extract named fields
2  imports, constants, load, scheme_id, delta   Define the constants and helpers
3  collect, fetch                               Fetch the page and its fields
4  buckets_from, rows_from, classify            Classify the response
5  poll                                         Run one poll end to end
6  state_path, save                             Running 200 targets without losing writes
7  overdue_targets                              Running 200 targets without losing writes
8  the runner                                   Running 200 targets without losing writes
A missing block raises a NameError that names the missing function. Two more Python blocks are outside that list: the httpx sketch under Ask the origin, and the receiver under Who runs the loop. The receiver is its own script.
The assembled result is a gist, those 8 blocks in that order at 309 lines, with the target config below it. Read the blocks here for why each one is shaped the way it is, and take the file from there.
Set up before you write code
monitor.py needs Python 3.9 or newer, one dependency, and your API key:
uv venv && uv pip install httpx        # or: python3 -m venv .venv && .venv/bin/pip install httpx
export EVOMI_SCRAPER_KEY="paste-your-key-here"
uv run python monitor.py target.json   # the 8 blocks assembled, or the gist above
fcntl makes the locking POSIX-only, so monitor.py runs on Linux and macOS but not on Windows. The later block for the webhook receiver is a separate script, adding flask.
New accounts get a key on a free trial from the Evomi dashboard. The key is in the Scraper API playground, alongside the 2 numbers you need:
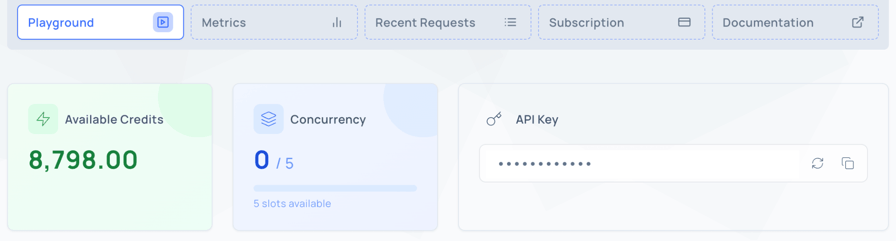
Your agent compares the credit minimum below against the Available Credits figure, and the concurrency limit sets how many targets can run at once.
Run the target through that same screen once before writing any code. Paste the URL, set scraping mode to Request, set output to Markdown, and set delivery to JSON. Select Include Content, then execute it:
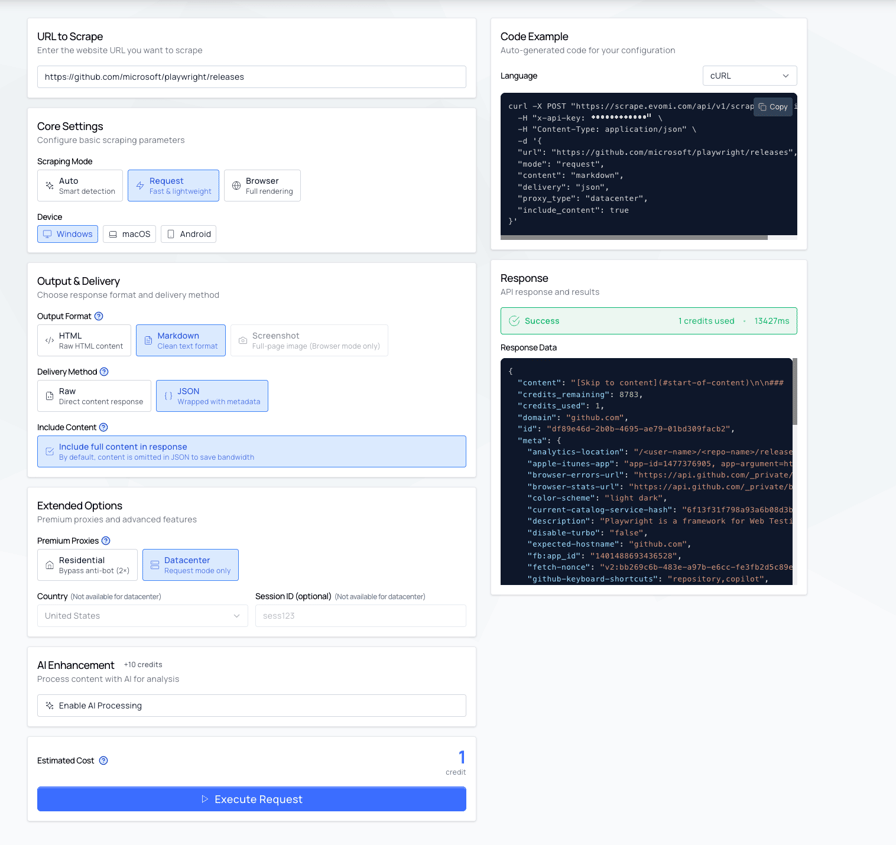
That run settles most of what can go wrong later. A first run that fails in Python is ambiguous, because the key, the target and the code are all possible causes at once. A run that already worked in the browser leaves one possible cause.
JSON delivery keeps the page body opt-in, so an extraction-only call stays small. Your agent still needs that body for the arrival check, so it passes include_content on every call. Check the extraction scheme separately, by posting it with test: true.
Define the constants and helpers
The thresholds here are the ones you tune, and everything per-target stays in the config above:
import fcntl, hashlib, json, os, pathlib, re, sys, tempfile, time
from collections import Counter
import httpx

API = "https://scrape.evomi.com/api/v1/scraper/realtime"
KEY = os.environ.get(
    "EVOMI_SCRAPER_KEY"
)  # checked in fetch, so --overdue runs without it
STATE_DIR = pathlib.Path(os.environ.get("MONITOR_STATE", "state"))

STEPS = [
    ("datacenter", {"mode": "request", "proxy_type": "datacenter"}),
    ("residential", {"mode": "request", "proxy_type": "residential"}),
    (
        "browser",
        {"mode": "browser", "proxy_type": "residential", "wait_until": "networkidle"},
    ),
]
MAX_THROTTLE_RETRIES = 3
GONE_BEFORE_DEAD = 3  # a deploy can 404 for one poll
UNUSABLE_BEFORE_HOLD = 3  # a redesign breaks every selector at once
STEP_RETRY = 24  # re-test the cheap step about daily
MIN_CREDITS = 500  # set this from your own balance
TASK_POLLS, TASK_GAP = 10, 6  # a long scrape comes back as a task handle

CHALLENGE = re.compile(
    r"prove your humanity|just a moment|checking your browser|"
    r"attention required|enable javascript and cookies|"
    r"unusual traffic|pardon our interruption|incapsula|bot manager|"
    r"verify you are a human|enter the characters you see|"
    r"access (?:to this page has been )?denied",
    re.I,
)


def load(path):
    try:
        return json.loads(path.read_text())
    except FileNotFoundError:
        return {}  # a new target has no state yet
    except (ValueError, OSError):
        path.replace(path.with_suffix(".corrupt"))
        return {"lost": True}  # re-baseline, and say so in the report


def scheme_id(spec):
    """Everything that shapes the fingerprint. `min_rows` does not, so editing a
    threshold keeps the baseline, and editing the scheme or the volatile list starts one.
    """
    keyed = {k: spec[k] for k in ("extract_scheme", "volatile_fields") if k in spec}
    return hashlib.sha256(json.dumps(keyed, sort_keys=True).encode()).hexdigest()[:8]


def delta(before, after):
    """Multiset difference, so duplicate rows cannot produce an empty delta."""
    b = Counter(json.dumps(r, sort_keys=True) for r in (before or []))
    a = Counter(json.dumps(r, sort_keys=True) for r in after)
    return {
        "added": [json.loads(x) for x in (a - b).elements()],
        "removed": [json.loads(x) for x in (b - a).elements()],
    }
A truncated state file costs you one re-baseline, not a crash loop that breaks every run until someone notices. The poll renames it aside and reports lost_baseline, so a re-baseline you didn't ask for is visible. A missing file is the ordinary case and reports nothing.
Fetch the page and its fields
Your fetch asks for markdown and extraction together, so you get the challenge text and the small payload from one call:
def collect(payload):
    """A realtime call hands back a task handle when the scrape lasts beyond the request,
    with the credit already reserved. Follow it, and the page you paid for is the one you use.
    """
    path = payload.get("check_url")
    if not path or payload.get("content") is not None:
        return payload
    root = API.rsplit("/api/", 1)[0]
    for _ in range(TASK_POLLS):
        time.sleep(TASK_GAP)
        done = httpx.get(root + path, headers={"x-api-key": KEY}, timeout=60).json()
        if done.get("status") != "processing":
            if done.get("content") is None:
                done["task_failed"] = True  # ended, and never produced a page
            return done  # same shape as a direct response
    return payload  # still running, classify calls it pending


def fetch(url, spec, params):
    if not KEY:  # cron does not inherit your shell
        sys.exit("EVOMI_SCRAPER_KEY is not set")
    body = {
        "url": url,
        "delivery": "json",
        "include_content": True,
        "content": "markdown",  # a small payload the challenge check can read
        "extract_scheme": spec["extract_scheme"],
        **params,
    }
    r = httpx.post(
        API,
        headers={"x-api-key": KEY},
        json=body,
        timeout=httpx.Timeout(90.0, read=120.0),
    )
    payload = (
        r.json()
        if r.headers.get("content-type", "").startswith("application/json")
        else {}
    )
    reserved = payload.get("credits_reserved")  # cost arrives as credits_reserved
    payload = collect(payload)
    return (
        r.status_code,
        payload,
        float(r.headers.get("x-credits-used") or reserved or 0),
        payload.get("credits_remaining"),
    )
On the releases page, requesting markdown alongside the scheme dropped the JSON envelope from 525,801 bytes to 54,205. The response still carried enough text for the challenge check. The Reddit challenge page converted to 455 bytes of markdown, with the marker at character 2.
Markdown buys those 2 things here, and not the 298 spans. Your fingerprint reads the extraction output rather than this text, so attribute noise never reaches it on either format. Keep markdown as the diff input when you drop the scheme and compare the page itself, which is the layer above.
Classify the response
Your classifier names the failure, and your agent acts on that name:
def buckets_from(payload):
    """One list per root nest. Merged, a bucket that collapsed to 0 rows hides behind
    a healthy sibling, and a field from one bucket reads as absent on the other."""
    return [b if isinstance(b, list) else [b] for b in payload.get("extraction") or []]


def rows_from(payload):
    """Every bucket, flattened. Returning only the first silently drops the rest."""
    return [r for b in buckets_from(payload) for r in b]


def classify(http_status, payload, spec):
    inner = payload.get("status_code")  # the origin's status, not the API's
    body = payload.get("content") or ""
    hit = CHALLENGE.search(body[:4000])

    if http_status == 429 or inner == 429:
        return "throttled", "rate limited"
    if http_status in (401, 402):
        return "account", f"API returned {http_status}, key or credits"
    if http_status >= 500:
        return "api_error", f"API returned {http_status}"  # not a target problem
    if http_status not in (200, 202):  # 202 is an accepted task, not a failure
        return "transport", f"API returned {http_status}"
    if payload.get("task_id") and payload.get("content") is None:
        if payload.get("task_failed"):  # it finished, and no page came back
            return "api_error", "the task ended without content"
        return "pending", "scrape still running, the credit is already reserved"
    if inner in (401, 403):
        if hit:  # a challenge page can carry a 403
            return "refused", f"challenge page: {hit.group(0)!r}"
        return "blocked", f"origin returned {inner}"  # login or geo block
    if inner in (404, 410):
        return "gone", f"origin returned {inner}"
    if isinstance(inner, int) and inner >= 500:
        return "origin_error", f"origin returned {inner}"
    if isinstance(inner, int) and inner not in (200, 203):
        return "unexpected_status", f"origin returned {inner}"

    if hit:
        return "refused", f"challenge page: {hit.group(0)!r}"

    want = spec.get("expect_text")
    if want and want.lower() not in body[:8000].lower():
        return "wrong_page", f"{want!r} absent from the page"

    buckets = buckets_from(payload)
    rows = [r for b in buckets for r in b]
    if len(rows) < spec.get("min_rows", 1):
        return "thin", f"{len(rows)} rows, expected at least {spec.get('min_rows', 1)}"
    if any(not b for b in buckets):
        empty = sum(1 for b in buckets if not b)
        return "thin", f"{empty} of {len(buckets)} buckets came back empty"
    for f in spec.get("required_fields", []):
        seen = [r for r in rows if f in r]  # the bucket that declares the field
        if not seen:
            return "thin", f"field {f!r} on no rows"
        # A field whose selector matched nothing comes back `[]`, which is not None.
        # `False` and `0` must still count, for `exists` and `count` fields.
        got = sum(1 for r in seen if r.get(f) not in (None, "", [], {}))
        if got < len(seen) * 0.8:
            return "thin", f"field {f!r} populated on {got}/{len(seen)} rows"
    return "ok", ""
A challenge page can arrive with a 403 as easily as a 200, so the regex runs before blocked does. Those challenge strings stop matching as sites reword their challenge pages, and expect_text is what notices when they do. A challenge page carries none of your text, so the poll reports wrong_page, which fails the run rather than escalating. Keeping the regex current is what buys the automatic browser step. expect_text makes sure a page it misses reaches you rather than passing as healthy.
Production pages carry the occasional row with a missing field, and a check that requires 100% will alert you over one malformed listing. A selector that has completely broken tends to return nothing on any row.
Run one poll end to end
Your poll combines those functions and walks the steps only for outcomes that escalate. It writes state in a finally, so a raised exception still records what the poll spent:
def poll(spec, announce=lambda report: None):
    path = state_path(spec)
    with open(path.with_suffix(".lock"), "w") as lf:
        try:
            fcntl.flock(lf, fcntl.LOCK_EX | fcntl.LOCK_NB)  # one poller per target
        except BlockingIOError:  # last cycle is still on this target
            return {"url": spec["url"], "outcome": "busy", "credits": 0.0}, None
        mem = load(path)
        lost = mem.pop("lost", False)  # a corrupt file was set aside
        spend, notes, throttles, i = 0.0, [], 0, mem.get("step", 0)
        if i and mem.get("n", 0) % STEP_RETRY == 0:
            i = 0  # a challenge that stopped should not bill forever
        try:
            if mem.get("dead"):
                return {"url": spec["url"], "outcome": "dead", "credits": 0.0}, None
            if mem.get("unusable", 0) >= UNUSABLE_BEFORE_HOLD:
                mem["holds"] = mem.get("holds", 0) + 1
                if (
                    mem["holds"] % STEP_RETRY
                ):  # probe once a day in case the page recovered
                    return {
                        "url": spec["url"],
                        "outcome": "held",
                        "reason": "selectors matched nothing on the last "
                        f"{UNUSABLE_BEFORE_HOLD} polls",
                        "credits": 0.0,
                    }, None
                mem["unusable"] = 0
            if mem.pop("remaining", MIN_CREDITS) < MIN_CREDITS:
                # pop, so the poll after this one re-reads the balance and a top-up clears it
                return {"url": spec["url"], "outcome": "budget", "credits": 0.0}, None

            while i < len(STEPS):
                name, params = STEPS[i]
                status, payload, credits, remaining = fetch(spec["url"], spec, params)
                spend += credits
                if remaining is not None:
                    mem["remaining"] = remaining  # the next poll stops before spending

                outcome, why = classify(status, payload, spec)
                if outcome != "gone":
                    mem["gone"] = 0  # only consecutive 404s latch

                # None of these improve by paying more, so none escalate.
                if outcome in (
                    "gone",
                    "unexpected_status",
                    "origin_error",
                    "account",
                    "api_error",
                    "blocked",
                    "wrong_page",
                    "pending",
                    "transport",
                ):
                    if outcome == "gone":
                        mem["gone"] = mem.get("gone", 0) + 1
                        if mem["gone"] >= GONE_BEFORE_DEAD:
                            mem["dead"] = why  # stop paying for it hourly
                    return {
                        "url": spec["url"],
                        "outcome": outcome,
                        "reason": why,
                        "step": name,
                        "credits": spend,
                        **({"gone": mem["gone"]} if mem["gone"] else {}),
                    }, None

                if outcome == "throttled":
                    throttles += 1
                    if throttles > MAX_THROTTLE_RETRIES:
                        return {
                            "url": spec["url"],
                            "outcome": "throttled",
                            "credits": spend,
                        }, None
                    time.sleep(
                        min(payload.get("reset", 60), 300)
                    )  # the server says how long
                    continue  # same step, not the next

                if outcome != "ok":
                    notes.append(f"{name}: {why}")
                    i += 1
                    continue

                rows, fp = stable(
                    rows_from(payload), set(spec.get("volatile_fields", []))
                )
                rebaselined = mem.get("print") is None  # new target, or edited scheme
                changed = not rebaselined and fp != mem["print"]
                moved = delta(mem.get("rows"), rows) if changed else None

                report = {
                    "url": spec["url"],
                    "outcome": "ok",
                    "step": name,
                    "poll": mem.get("n", 0) + 1,
                    "rows": len(rows),
                    "credits": spend,
                    "changed": changed,
                    "rebaselined": rebaselined,
                    **({"lost_baseline": True} if lost else {}),
                    "print": fp[:12],
                    "delta": moved,
                    "skipped": notes,
                }
                if changed:
                    announce(report)  # before the baseline moves, so a
                    # failed send is found again next poll
                mem.update(
                    step=i,
                    print=fp,
                    rows=rows,
                    gone=0,
                    unusable=0,
                    holds=0,
                    n=mem.get("n", 0) + 1,
                    last_success=time.time(),
                )
                return report, rows

            mem["unusable"] = mem.get("unusable", 0) + 1
            return {
                "url": spec["url"],
                "outcome": "unusable",
                "credits": spend,
                "skipped": notes,
                "runs": mem["unusable"],
            }, None

        except Exception as e:
            mem["gone"] = 0  # not reaching the origin is not a 404
            return {
                "url": spec["url"],
                "outcome": "error",
                "reason": f"{type(e).__name__}: {e}",
                "credits": spend,
            }, None
        finally:
            mem["spend"] = round(mem.get("spend", 0.0) + spend, 1)
            save(path, mem)  # every exit records what it spent
announce runs before the baseline moves. A notifier that raises keeps the old fingerprint in place, and the next poll reports the change again instead of losing it. Delivering after the write would announce each change exactly once, which is the wrong number when the send can fail. The trade is at-least-once, so a send that lands and then loses the state write arrives twice. Deduplicate on the fingerprint at the receiving end if that matters.
Your baseline moves only on a poll that succeeds, so a failed poll costs you coverage for that interval rather than the change itself. The next successful poll compares its fingerprint against the last good fingerprint, so the net difference arrives in one delta. Anything that appeared and reverted while the monitor was down never arrives at all.
Not every failure needs a more expensive fetch
Escalating through the scraping modes and proxy types fixes one failure in particular, and it handles that one well. A target refused you, so the next step fetches it differently. Several other failures reach the same code path, and each of those is already answered on the first call.
The subreddit that answered the HTTP path with a challenge page, 1 step at a time:
step                     credits   secs     bytes  posts  title
request + datacenter        1.0    1.6   166,558      0  Reddit - Prove your humanity
request + residential       2.0    2.4   166,558      0  Reddit - Prove your humanity
browser + residential       5.0   14.7   879,825    107  webscraping
Both request steps returned the same 166,558 bytes. This target gates on rendering rather than the exit address, so residential changed nothing here. Residential stays in STEPS for the address-based case, which this target didn't exercise.
The post count on that page moves between renders. A feed like this needs your min_rows and named fields rather than a fingerprint over every row. The browser step above is the refused case working as it should. refused and thin are the 2 outcomes where the next step is worth paying for.
That walk is also paid once. Your agent stores the step that served and starts there on the next poll, so the second poll of this target cost 5 credits. A site can stop serving the challenge, though, so your agent re-tests the cheap step every STEP_RETRY polls.
Without a classifier, an agent walks every step against a URL that doesn't exist:
{"step": null, "credits": 8.0, "unusable": true, "skipped": [
   "datacenter: 1 rows, expected at least 5",
   "residential: 1 rows, expected at least 5",
   "browser: 1 rows, expected at least 5"]}
The origin had answered 404 on the first call, for 1 credit.
Callers make the same mistake with rate limiting. Bursting concurrent requests against a trial account, where x-ratelimit-limit reports 5:
burst of  5   200 x 5
burst of 12   200 x 9, 429 x 2, 202 x 1
burst of 25   200 x 15, 429 x 10
Credits are reported on completed fetches: x-credits-used came back on the 200s and on none of the 429s. Cap the retries regardless. The 429 body carries the wait to apply:
{"error":"Concurrency limit exceeded (5/5)","limit":5,"reset":60}Read reset rather than guessing. A fixed 30-second backoff retries against a counter that's documented to clear after 60 seconds. That limit is per key and rises with the plan, from 10 on pay-as-you-go to 105 on Business.
Naming the failure fixes all of it:
Outcome | What it means | What the agent does |
|---|---|---|
| a challenge page came back | escalate, this is what the steps are for |
| selectors matched too little | escalate, then report unusable |
| 429 from the API | wait |
| origin returned 404 or 410 | count it, and stop polling once 3 in a row agree |
| origin returned 401 or 403 | stop, the page needs auth you aren't sending |
|
| stop, the URL now serves something else |
| any other origin status | stop, look at what the origin sent |
| origin returned 5xx | stop, retry on the next scheduled poll |
| a task handle came back, content still to follow | stop, the scrape is running and the credit is reserved |
| any other status from the API | stop, a malformed request fails the same way on every step |
| selectors matched nothing on 3 polls in a row | stop escalating, keep failing the run so someone looks, and probe once a day in case the page recovered |
| a 5xx from the API, or a task that ended with no page | stop, the target is fine, retry on the next scheduled poll |
| the API returned 401 or 402 | stop every target, your key or balance is the issue |
throttled needs patience rather than money. Every outcome below it says stop, and that is what naming them changed. The 404 above walked all 3 steps because nothing had named it.
Twelve of those 13 outcomes name what came back. held is different, because it reports the agent's own state, and 5 more do the same. unusable names a target whose selectors matched too little on every step, and dead marks a target that has latched. budget marks a balance under the minimum, and busy marks a target where the last cycle still holds the lock. error marks a poll that raised an exception.
With that split, a URL that doesn't exist costs 1 credit a poll instead of 8, and reports origin returned 404. A redesign that empties every selector is the same pattern. unusable counts the same way and holds after 3 polls, rather than walking all 3 steps on every target every poll.
A deploy, a cache purge or a brief redirect can 404 for one poll, and a target you retire on that one answer stays retired. The site comes back, but the poll returns dead for free, and the run still exits 0. Counting to 3 costs 2 more credits once, and only on a target that never recovers on its own.
Deleting a target's state file re-arms it if you retire one you meant to keep. A latched target stops updating last_success, so the overdue check below tells you it happened.
Running 200 targets without losing writes
Your agent so far is correct for one target in one process. The cost table assumed 200 targets, and at that size, you want more than one poller. A single shared state file stops working the moment two of them write it.
One test ran 20 pollers against one shared state file, where saving one target rewrites all 20 entries. It kept 6 of 20 targets and silently discarded 51 of 60 poll results, with no error raised anywhere. Atomic rename leaves either the old file or the new one, never a torn one. The rename doesn't prevent a lost update, because 2 processes read the same dictionary before either writes.
One file per target plus an exclusive lock removes both problems. It also drops the O(N) rewrite that made the race window wide:
def state_path(spec):
    """Key on the scheme too. Two watches on one URL otherwise share a baseline,
    and each poll reads the other's fingerprint as a change it must not report."""
    STATE_DIR.mkdir(parents=True, exist_ok=True)
    key = f"{spec['url']}\n{scheme_id(spec)}"
    return STATE_DIR / f"{hashlib.sha256(key.encode()).hexdigest()[:16]}.json"
def save(path, mem):
    fd, tmp = tempfile.mkstemp(dir=str(path.parent), suffix=".tmp")
    try:
        with os.fdopen(fd, "w") as f:
            json.dump(mem, f, indent=2)
            f.flush()
            os.fsync(f.fileno())  # the rename must not finish before the data
        os.replace(tmp, path)
    except BaseException:
        pathlib.Path(tmp).unlink(missing_ok=True)
        raise
The same 20-process test against this version keeps 20 of 20 targets and records 60 of 60 polls. It writes a heartbeat for every target and leaves no stray temp files.
Your change detector's healthy state and its dead state both produce nothing, so a heartbeat separates them. Store the time of the last success and alert on its absence:
def overdue_targets(specs, max_age):
    out, now = [], time.time()
    for s in specs:
        mem = load(state_path(s))            # load(), so a missing or corrupt file
        last = mem.get("last_success")       # reports overdue instead of raising
        if last is None or now - last > max_age:
            out.append({"url": s["url"], "age": None if last is None else round(now - last)})
    return out
Run that check on its own schedule. The overdue check then reports a monitor that has quietly stopped working, as long as that check keeps running.
Put your state directory somewhere that survives a deploy. On a container's ephemeral disk, the first poll after every release finds no baseline, so it stores one and reports rebaselined. A poll that reports that nothing moved isn't the same as a poll with nothing to compare against. You lose whatever changed during the deploy, and no alert reports it.
The lock has its own boundary. flock coordinates pollers on one host, not across a fleet. That limit is one reason to hand the clock to the platform schedule below.
One limit decides whether 200 targets is a scheduling problem at all. Read x-ratelimit-limit off your own response rather than assuming. Fetch time is the other input, and it varies by target: 1.6 seconds on one datacenter fetch here, and 13.4 seconds on the releases page.
With 5 running at once, 200 targets finish in a little over a minute at 1.6 seconds each. At 13.4 seconds each, they take about 9 minutes. An hourly cycle clears both. Time your own fetches before sizing a pool. The runner below polls serially, which takes 5 times as long for the same credits, so a pool of 5 makes x-ratelimit-limit the constraint.
A pool means running that runner more than once. Split the target files across 5 scheduled entries, or point 5 copies at the same list. The lock gives each target to whichever copy reaches it first, and the others report busy and spend nothing.
Browser renders took closer to 15 seconds each. With 5 running at once, 200 render targets take about 10 minutes, and at the Developer limit of 25, they take about 2 minutes.
A 5-minute cycle across 2,000 targets is 3,200 seconds of fetching inside a 300-second window, so it wants 11 fetches at once. That is 1 past pay-as-you-go and inside Developer. At that point, you either move up a tier in the table above or hand the schedule to the platform.
With those in place, the agent is complete, and the runner takes one config per target:
if __name__ == "__main__":
    args = sys.argv[1:]
    if not args:
        sys.exit("usage: monitor.py [--overdue] <target.json> ...")
    dead_man = args[0] == "--overdue"
    specs = [
        json.loads(pathlib.Path(p).read_text())
        for p in (args[1:] if dead_man else args)
    ]

    if dead_man:  # run this on its own schedule
        late = overdue_targets(specs, max_age=3600)
        print(json.dumps({"overdue": late}))
        sys.exit(1 if late else 0)

    def alert(report):  # swap the transport, keep the shape
        line = {"alert": report["url"], "delta": report["delta"]}
        hook = os.environ.get("SLACK_WEBHOOK")
        if not hook:
            print(json.dumps(line))
            return
        httpx.post(
            hook, json={"text": json.dumps(line, indent=2)[:3000]}, timeout=30
        ).raise_for_status()

    failed = 0
    for spec in specs:
        try:
            report, rows = poll(spec, announce=alert)
        except Exception as e:  # a bad config must not end the cycle
            report = {
                "url": spec.get("url", "?"),
                "outcome": "error",
                "reason": f"{type(e).__name__}: {e}",
                "credits": 0.0,
            }
        print(json.dumps(report))
        failed += report["outcome"] not in ("ok", "dead", "busy")
        if report["outcome"] == "account":
            break  # key or balance, the rest will fail too
    sys.exit(1 if failed else 0)  # your scheduler reads this, not stdout
On one server, cron supplies the clock. Pass the key on the line, since a scheduler runs with a minimal environment rather than your shell's. Give the dead-man switch its own entry:
0  * * * * cd /srv/monitor && EVOMI_SCRAPER_KEY=xxx .venv/bin/python monitor.py targets/*.json >> poll.log 2>&1
15 * * * * cd /srv/monitor && EVOMI_SCRAPER_KEY=xxx .venv/bin/python monitor.py --overdue targets/*.json >> overdue.log 2>&1
Running monitor.py against the releases page twice gives the quiet case. A monitor on a page that changes a few times a month reports no change on most polls:
{"url": "https://github.com/microsoft/playwright/releases", "outcome": "ok", "step": "datacenter",
 "poll": 1, "rows": 10, "credits": 1.0, "changed": false, "rebaselined": true,
 "print": "ce388e640146", "delta": null, "skipped": []}
{"url": "https://github.com/microsoft/playwright/releases", "outcome": "ok", "step": "datacenter",
 "poll": 2, "rows": 10, "credits": 1.0, "changed": false, "rebaselined": false,
 "print": "ce388e640146", "delta": null, "skipped": []}
With no SLACK_WEBHOOK set, alert prints the change and nothing else. With one set, it posts, and raise_for_status makes a failed send hold the baseline.
That fingerprint is the value on the day it was captured, and a new run returns a different one once a release ships. The first poll has no stored fingerprint to compare against, and it reports rebaselined.
poll carries 3 guards, and each maps to a failure that happens often:
- Cap the throttle retries, or a rate-limited account spins forever and stops monitoring everything else.
- Responses carry
credits_remaining, so read it when it's there and refuse to poll below a minimum. The balance stays visible on the poll before it becomes an error. - Wrap the poll body so the state write happens in a
finally, since the poll spends credits before state is durable.
Size MIN_CREDITS against the Available Credits figure on the playground screen. A balance already under the minimum returns budget and spends nothing. The guard drops the stored balance as it does that. The next poll fetches and re-reads it, so a top-up clears the hold on its own. That alternation spends from the buffer the minimum holds back, and a balance the API refuses answers account and stops every target. The poll that crosses the minimum still finishes, since its page is already bought.
Who runs the loop, and where the change goes
Everything up to here assumes you own the schedule. Often you don't own it, and the platform that runs the fetch also runs the clock.
A saved config holds the URL and the extraction scheme, wrapped in a config object:
curl -X POST "https://scrape.evomi.com/api/v1/account/configs" \
  -H "x-api-key: $EVOMI_SCRAPER_KEY" -H "Content-Type: application/json" \
  -d '{"name": "playwright releases",
       "config": {"url": "https://github.com/microsoft/playwright/releases",
                  "mode": "request", "content": "markdown",
                  "extract_scheme": [ ... ]}}'
That call answers with {"success": true, "id": "cfg_...", ...}, and the id that it returns is the config_id that a schedule takes. A schedule runs that config on an interval, and its webhook type picks the destination, with custom meaning your own endpoint:
curl -X POST "https://scrape.evomi.com/api/v1/account/schedule" \
  -H "x-api-key: $EVOMI_SCRAPER_KEY" -H "Content-Type: application/json" \
  -d '{"name": "daily release check", "config_id": "cfg_0l84zmqO",
       "interval_minutes": 1440, "stop_on_error": true,
       "webhook": {"url": "https://your-server.example/hooks/evomi",
                   "type": "custom", "events": ["completed", "failed"],
                   "secret": "your-webhook-secret"}}'
The response confirms what the platform now owns:
{"id": "job_5gAoJ8GK", "config_id": "cfg_0l84zmqO", "interval_minutes": 1440,
 "is_active": true, "next_run": "...", "stop_on_error": true,
 "webhook": {"events": ["completed", "failed"], "type": "custom",
             "url": "https://your-server.example/hooks/evomi", "secret": "..."}}
stop_on_error is the platform's version of the dead flag that the agent sets on a gone outcome. It defaulted to true when this was checked, and the schedule above sets it explicitly rather than trusting a default that can change. Giving the platform the cron, the concurrency limit, the backoff and the timeout handling still leaves the whole detector with you.
The run history at /account/schedule/{id}/runs replaces the run log you stop writing.
A saved config stores your extract_scheme, and it drops delivery and include_content. A scheduled run therefore delivers raw text, not the extracted rows, whatever the stored scheme says. Either run your own extraction on the receiving side, or keep the schedule for the fetch and call the API yourself when the shape matters.
The schedule posts to a URL it can reach, so the receiver needs a public address rather than a localhost port. The receiver verifies the signature before anything else. The header is X-Evomi-Signature, and the secret is the one stored on the schedule:
import hashlib, hmac, os
from flask import Flask, request

app = Flask(__name__)
SECRET = os.environ["EVOMI_WEBHOOK_SECRET"].encode()


@app.post("/hooks/evomi")
def receive():
    # HMAC the bytes that arrived, never a re-serialization of the parsed body.
    raw = request.get_data()
    expected = "sha256=" + hmac.new(SECRET, raw, hashlib.sha256).hexdigest()
    if not hmac.compare_digest(request.headers.get("X-Evomi-Signature", ""), expected):
        return "bad signature", 401

    event = request.get_json(silent=True) or {}  # a 415 here reads as an auth failure
    if event.get("event") != "completed":
        return "noted", 200  # started and failed, alert separately
    # Same check as the polling path, only the trigger changed.
    return "ok", 200
A JSON encoder is free to space its separators differently from the sender. A re-serialized body can therefore fail against a signature computed over the wire bytes. The 401 on every valid delivery then looks like a wrong secret rather than a wrong input:
signature as sent       sha256=a939db1d00c6bdb844b1...
re-serialized body      sha256=25ce0870a511549dae76...   MISMATCH
raw request bytes       sha256=a939db1d00c6bdb844b1...   MATCH
That receiver, against 4 deliveries:
valid delivery                         200  ok
signature over a re-serialized body    401  bad signature
no signature header                    401  bad signature
a started event                        200  noted
Where the change goes after that depends on who is reading it. A person wants Slack or Discord, and the webhook type field routes straight there. A warehouse wants the run written to object storage, and an LLM agent wants a tool it can call. Evomi's Model Context Protocol server exposes that tool. evomi-mcp installs with pip install evomi-mcp, and 1 credential is enough to configure it. Its tools include scrape_url, create_schedule, list_schedule_runs and get_account_info. An agent can drive the configs, schedules and credit checks this section builds by hand.
The delta is already the right shape for all 3 readers, because it names what moved and doesn't forward the page.
When a person reads the alert, 1 more field is worth its cost on the poll that changed. screenshot: true in browser mode returns a screenshot_uri, a hosted PNG, for 1 credit beyond the render. On the releases page, that call billed 6 credits and returned the whole page, 1,273 by 21,100 pixels. Crop the image before you put it in an alert.
The URI is directly fetchable, and the CDN held it for 30 days when this was checked. Copy it into your own storage in the same step rather than sizing a window against that number.
When the page needs a browser
Request mode returns one document per call. These 4 cases ask for more than one document, and each has an answer:
- Monitoring behind a login, where a session cookie has to persist across navigations.
- Watching a value that only appears after a form submit or a filter selection.
- Reading a page whose content loads on scroll rather than on navigation.
- Confirming that a multi-step flow still completes end to end.
Only 2 of those 4 need a session at all. For the form submit and the scroll, the Scraper API drives the page at the same 5 credits as a render. You hold no WebSocket open.
js_instructions takes a list of steps, click, wait_for and fill among them. Clicking a pagination link and waiting for the next page's marker took 3.7 seconds and returned page 2.
Two things need care:
filltargets text inputs, and it left aselect-based filter unchanged when tested. The returned page confirms which of your steps applied.- Give
wait_fora marker that the page actually renders. An unmatched marker reaches the browser timeout near 50 seconds. Your classifier stops the poll on that, so the target waits for its next scheduled poll.
For a page that loads on scroll, use execute_js, which accepts a promise and waits for it. Scrolling quotes.toscrape.com/scroll 8 times returned 92 quotes where a plain fetch returned 0 quotes and 2,486 bytes. execute_js takes an expression, so hand it the value itself rather than a return.
The other 2 cases need a session that lasts beyond your request. The Evomi Scraping Browser exposes a managed Chromium over a Chrome DevTools Protocol WebSocket, on a key and plan of its own. You drive it from Playwright, Puppeteer or any other CDP client.
The Scraping Browser bills the time a session stays open rather than the call, so one connection carries a whole login-and-navigate sequence. Plans state an allowance in hours as well as credits, and these were the published tiers on September 2026:
Evomi Scraping Browser plan | Per month, September 2026 | Credits, or hours | Concurrent sessions | Session cap |
|---|---|---|---|---|
Prototyping | $24.99 | 60,000, or 125 | 3 | 15 minutes |
Growth | $129.99 | 350,000, or 729 | 20 | 60 minutes |
Scale | $249.99 | 750,000, or 1,562 | 50 | 120 minutes |
Each tier works out near 480 credits an hour, or 8 credits a minute. The session caps run well past what one poll needs to connect, navigate and close.
A session pays for itself once it does several navigations, which is what the login and multi-step cases above are. One document from one URL is a single Scraper API call, on the key you already have.
When the selectors stop matching
Selectors break, and they break silently. The completeness check reads that silence and reports it, so the check is its own step instead of an assertion inside the parser.
A count field gives a cheaper trigger. An extraction field of type: "count" returns a document-level integer, so 1 field can serve as a health check on the whole page:
{ "label": "n_releases", "type": "count", "selector": "section[aria-labelledby]" }A nested field whose selector matches nothing comes back as an empty list. The response keeps its shape, and the outcome comes from your completeness check. A completeness check that tests is not None counts 30 empty rows as 30 healthy ones. classify therefore tests for empty containers too.
classify as written already gets this signal from min_rows and required_fields. Read that count field from the same response if you want the single-field version. Adding the field changes the scheme and starts a new baseline.
The arrival check can still pass while min_rows or required_fields fails, though a page that has genuinely emptied looks the same. Either case needs a different alert from "the content changed". That alert belongs to you, the person who maintains the selectors.
The API can validate a scheme before saving it. POST /account/schemes with test: true runs it against a live URL and saves it once extraction comes back populated:
curl -X POST "https://scrape.evomi.com/api/v1/account/schemes" \
  -H "x-api-key: $EVOMI_SCRAPER_KEY" -H "Content-Type: application/json" \
  -d '{"name": "releases", "test": true,
       "config": {"url": "https://github.com/microsoft/playwright/releases",
                  "extract_scheme": [ ... ]}}'
A deliberately broken scheme came back as:
SCHEMA_TEST_FAILED   "All extraction results empty/null"
carried on HTTP 500, scheme not saved, 2.0 credits
The reason is named in the body, so match on SCHEMA_TEST_FAILED rather than on the status. Run that check in CI against a known-good URL. If a selector change empties the extraction, it fails on a pull request, before it reaches production. That check costs 1 scrape, 2 credits in the run above.
Keep the repair out of the schedule. Putting the self-repair in a model call is the tempting version. It makes the monitor wait on that call at exactly the moment it needs to be deterministic.
Alert on the count, regenerate the scheme however you like, validate it with test: true, and deploy it as a versioned config change. state_path already hashes the scheme into the state key. Adding a field therefore starts a new baseline and reports rebaselined rather than firing an alert on every target at once.
Where to stop
Five decisions are cheaper to settle before the first scheduled run than after it, and the first 2 are about what you don't build.
Check for a machine-readable source first. The releases page has a JSON API and an Atom feed. Across 5 rounds on each of 3 targets, the JSON API and the static file held a stable validator where proxied rendered HTML didn't.
A documented feed or API is usually the more stable input. The site behind the subreddit in the escalation example publishes an official API. Build a detector for pages that have neither.
Check whether something already does it. changedetection.io and urlwatch are mature open-source monitors. When this was written, both shipped CSS and XPath filters and readable diffs, and changedetection.io scheduled its own checks where urlwatch expected cron.
At the same date, changedetection.io paired with a companion Chrome container, and urlwatch ran Playwright locally. Both took a proxy endpoint, and urlwatch took one on its HTTP job.
Self-hosting either one means you bring the proxy addresses and the unblocking behind them. changedetection.io also sells a hosted plan with its own fetcher included. That fetch is the part the measurements above kept landing on, from the challenge page at 200 to the browser step that cleared it. The Scraper API supplies that, and the scheduling and webhooks above when you want the clock too.
Use one of them when a self-hosted UI over the scheduling and the diff is the whole job. Build here when the fetch is the hard part. That split moves if either project adds unblocking of its own, so read their READMEs before you decide.
Read the terms, then the robots file. Both carry the site operator's stated position. A monitor that ignores them carries risk that the technical question doesn't settle. Public information being technically reachable does not mean you are permitted to take it on a schedule.
Note where the agent runs. This is not legal advice. Whose machine makes the request has been treated as a legal distinction. A scheduled monitor on your own infrastructure is not the same as an agent running on a user's machine. The one built above is the first of those.
Set the poll interval from the data. When you poll faster than the value moves, you get the same value back. One news page compared as markdown gave 0 changed spans at 20 seconds and gave 4 at 150 seconds. Measure how often the value actually moves, then poll at a fraction of that.
Final thoughts
A change monitor is a detector with a fetcher attached. A response arriving isn't proof that the page you asked for arrived, since a challenge page also returns 200 and stays byte-identical. Comparing markdown instead of raw HTML removed every false alert on one release page. The agent here goes further and fingerprints named fields instead of the page, which also cuts the payload and hands you a readable delta. Stop if the page has a JSON API or a feed, and use changedetection.io or urlwatch unless the fetch is the hard part. Point this code at 1 page you care about, run it a week, then read the credits it spent and count the false alerts.
FAQ
How do you monitor website changes in Python?
Poll on a schedule and compare a fingerprint of named fields, not the page itself. Pull the values you watch into JSON and drop the ones that move on their own. Sort what's left, hash it, and alert when the hash changes. On one measured page, whole-HTML comparison gave 298 changed spans per poll with nothing changed.
Why does change detection give false alerts?
Because many pages put per-render markup in HTML attributes. On one measured page, 298 changed spans appeared per poll with no content change. A hand-written filter for tokens, nonces and timestamps caught 23 of them. Requesting markdown instead carries the text without them, and 3 consecutive polls returned 0.
Can you check if a page changed without downloading it?
Sometimes. Send the last ETag back as If-None-Match, and a server that recognizes it answers 304 with an empty body. A JSON API and a static file answered 304 on all 5 rounds. Rendered HTML through a proxy pool moved its validator every time, and pinning the exit session didn't recover it.
Should an LLM read every page you monitor?
No. On one measured page, reading the full page cost a model 767 times the tokens of reading extracted fields. Use deterministic selectors to detect change, then call the model on the change alone. On a page that changes 3 times a month, that is 3 model calls instead of 720.
How often should you poll a page?
Poll at a fraction of how often the value actually moves, and measure that rate first. One news page compared as markdown gave nothing at 20 seconds and gave 4 changed spans at 150 seconds. Its values hadn't moved inside the shorter window. Polling inside that window adds cost without adding information.
When do you need a headless browser?
When the value only exists after the page runs. A form submit and a list that loads on scroll are driven inside one call, at 5 credits against 1 for a datacenter fetch. A login or a multi-step flow needs a session that outlives the request, billed on session time.
How do you monitor hundreds of pages reliably?
Give each target its own state file and take an exclusive lock around the read and write. A shared file lost 51 of 60 poll results across 20 processes with no error raised. Add a heartbeat timestamp per target, because a healthy monitor and a dead one both produce nothing.
Is scraping a site to monitor it legal?
It depends on the site, the data, and your jurisdiction, and this is not legal advice. Check for an official API, read the terms, and honor the robots file. Whose machine makes the request has also been treated as a legal distinction, so note where your monitor runs.